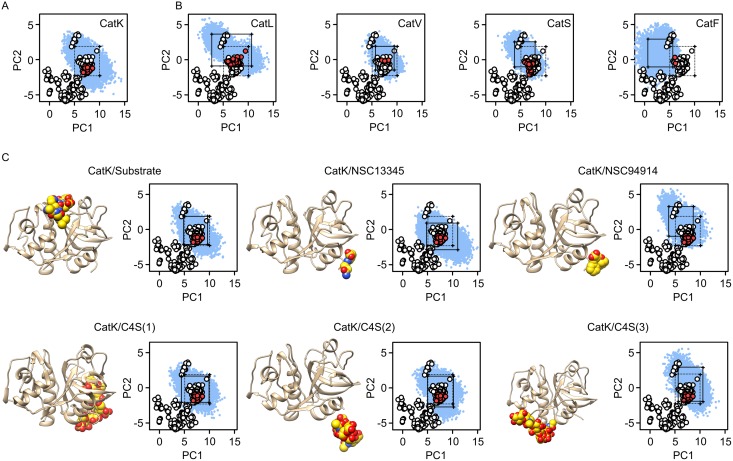
Fig 3. Principal component analysis of molecular dynamics simulations.
(A) Projection of MD conformers of cathepsin K onto the PC1/PC2 plane of the conformational space defined by the X-ray ensemble (see Fig 1). Only the section of interest is shown. The positions of animal peptidases from the X-ray ensemble are shown as red dots and non-animal peptidases as white dots, respectively. The positions of MD conformers are shown as blue dots. The rectangle denotes the boundaries of the 5th and 95th percentiles of each PC. (B) Projections of MD conformers of human cathepsins L, V, S and F onto PC1/PC2 plane of the conformational space defined by the X-ray ensemble. Full rectangles denote 5th and 95th percentiles of each PC for the examined MD ensemble, whereas dotted rectangles represent the boundaries of cathepsin K (see panel A). (C) Projections of MD conformers of cathepsin K in complexes with the substrate AGLKEDDA, small molecule effectors NSC13345 and NSC94914, and C4S bound to each of the three known binding sites onto the conformational space. Rectangles define the 5th and 95th percentiles of PC values as in panel B. The plots were drawn with GRAPHPAD PRISM 5.0 software (GraphPad Software, La Jolla, CA, USA) and molecular graphics with UCSF CHIMERA software [35].

