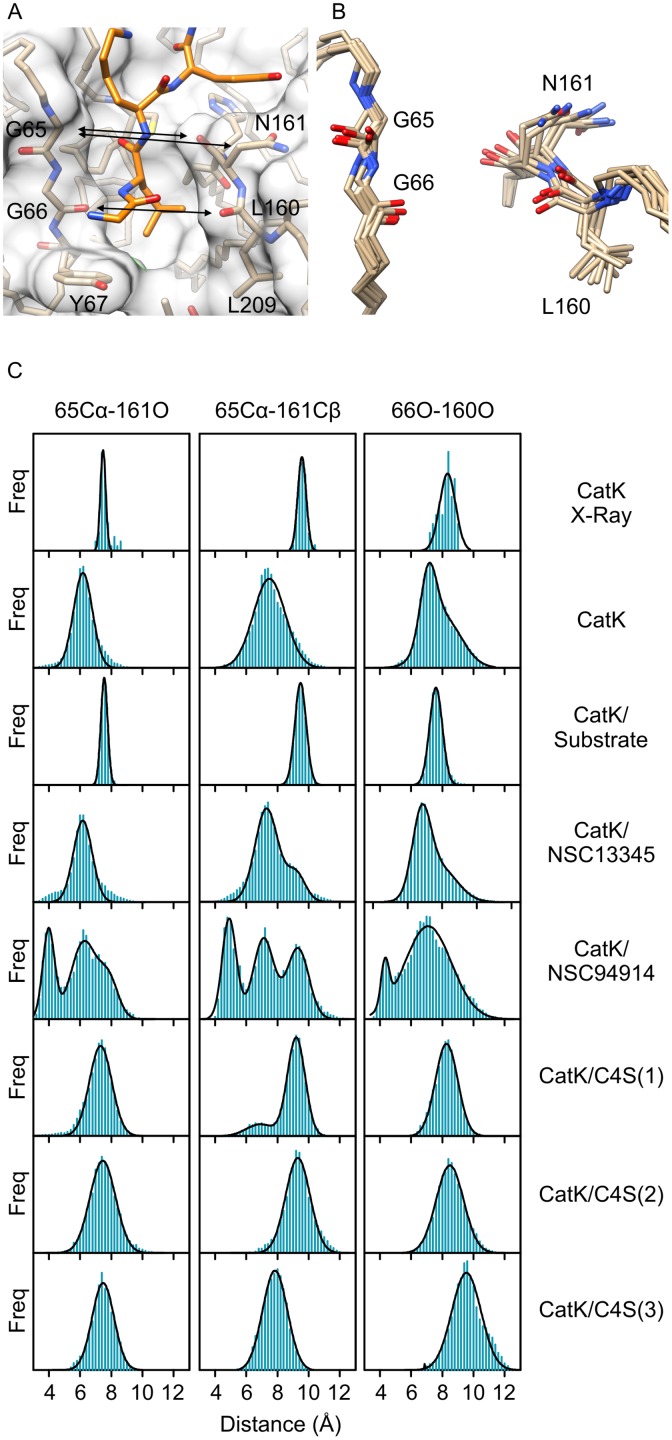
Fig 5. Active site geometry and dynamics in cathepsin K.
(A) S1-S2 region of cathepsin K (shown as transparent surface and tan sticks) with a docked substrate molecule (orange sticks). Interatomic distances limiting the width of the S2-S1 cleft are marked by arrows. (B) Superposition of average MD conformers of cathepsin K in free form or in complexes with the substrate AGLKEDDA, C4S (all three binding modes), NSC13345 or NSC94914, respectively. The representation highlights the variability of the region. (C) Distribution of interatomic distances in MD simulations of cathepsin K in free form, substrate-bound form and in complexes with allosteric effectors, respectively. The distribution of distances in all non-redundant X-ray structures is given for comparison. All populations were segregated into 0.2 Å wide bins. The curves were fitted assuming normal distribution of interatomic distances using models assuming one, two or three populations, as appropriate. The analyses were performed with Graph Pad Prism 5.0 Software. Molecular graphics were prepared with UCSF CHIMERA software [36].

