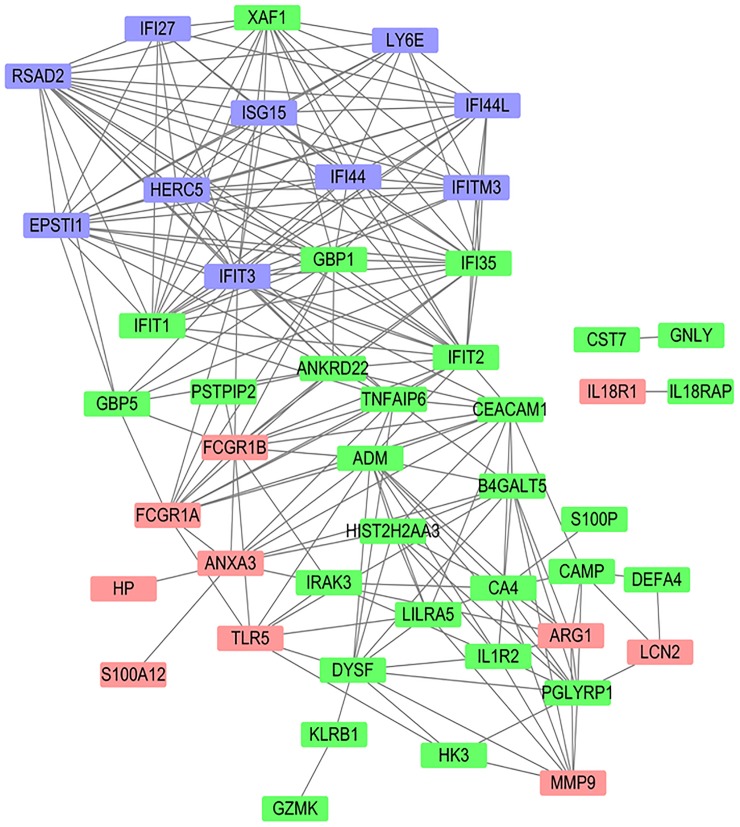
Fig 2. A co-expression network for the top genes in infectious and autoimmune diseases.
The 55 genes with fold change (FC>2.0) in at least 8 of the 20 discovery datasets were selected for co-expression analysis. The dataset GSE48348 with 734 blood samples was used to construct the co-expression network. A cutoff 0.50 for Pearson correlation coefficient was used to retain only strong connections among these 55 genes. Blue color indicates the 10 selected virus response genes (VRGs), while pink color indicates the 10 selected bacteria response genes (BRGs).

