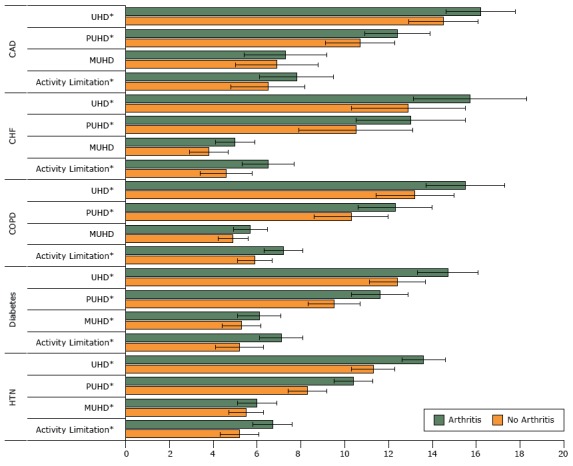
Figure 2.

Adjusted mean difference in unhealthy days and days with activity limitation in people with a chronic condition, with and without arthritis. Results were adjusted for age, sex, dual Medicare/Medicaid eligibility, rural/urban commuting area, and Charlson Comorbidity Index. Asterisks in figure indicate significant differences in regression-adjusted means between the arthritis and nonarthritis groups at P < .001; error bars indicate 95% confidence intervals. Abbreviations: CAD, coronary artery disease; CHF, congestive heart failure; COPD, chronic obstructive pulmonary disease; HTN, hypertension; MUHD, mentally unhealthy days; PUHD, physically unhealthy days; UHD, unhealthy days.
| Condition | Adjusted Mean No. (95% Confidence Interval) |
P Value | |
|---|---|---|---|
| No Arthritis | Arthritis | ||
| Hypertension | |||
| Activity limitation | 5.2 (4.3–6.1) | 6.7 (5.8–7.6) | <.001 |
| MUHD | 5.5 (4.6–6.4) | 6.0 (5.2–6.8) | <.001 |
| PUHD | 8.3 (7.4–9.2) | 10.4 (9.5–11.3) | <.001 |
| UHD | 11.3 (10.3–12.3) | 13.6 (12.6–14.6) | <.001 |
| Diabetes | |||
| Activity limitation | 5.2 (4.2–6.2) | 7.1 (6.0–8.2) | <.001 |
| MUHD | 5.3 (4.3–6.3) | 6.1 (5.2–7.0) | <.001 |
| PUHD | 9.5 (8.2–10.8) | 11.6 (10.4–12.8) | <.001 |
| UHD | 12.4 (11.0–13.8) | 14.7 (13.4–16.0) | <.001 |
| Chronic obstructive pulmonary disease | |||
| Activity limitation | 5.9 (5.0–6.8) | 7.2 (6.4–8.0) | <.001 |
| MUHD | 4.9 (4.1–5.7) | 5.7 (5.0–6.4) | .01 |
| PUHD | 10.3 (8.6–12.0) | 12.3 (10.6–14.0) | <.001 |
| UHD | 13.2 (11.4–15.0) | 15.5 (13.7–17.3) | <.001 |
| Congestive heart failure | |||
| Activity limitation | 4.6 (3.4–5.8) | 6.5 (5.3–7.7) | <.001 |
| MUHD | 3.8 (2.9–4.7) | 5.0 (4.1–5.9) | .003 |
| PUHD | 10.5 (8.0–13.0) | 13.0 (10.4–15.6) | <.001 |
| UHD | 12.9 (10.3–15.5) | 15.7 (13.1–18.3) | <.001 |
| Coronary artery disease | |||
| Activity limitation | 6.5 (4.8–8.2) | 7.8 (6.1–9.5) | <.001 |
| MUHD | 6.9 (5.0–8.8) | 7.3 (5.4–9.2) | .15 |
| PUHD | 10.7 (9.2–12.2) | 12.4 (10.8–14.0) | <.001 |
| UHD | 14.5 (12.9–16.1) | 16.2 (14.6–17.8) | <.001 |
