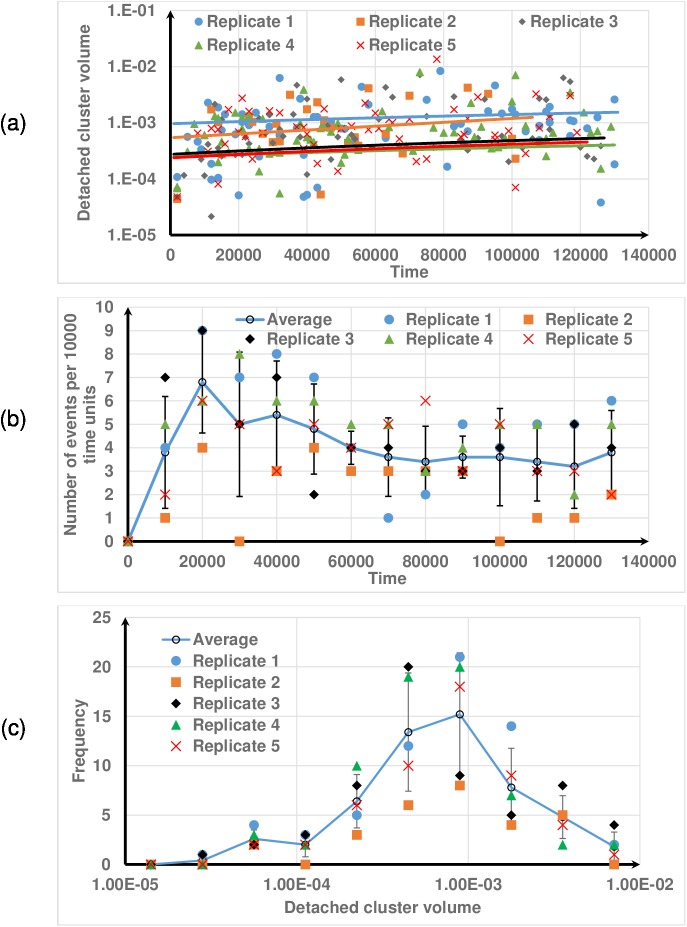
Fig 11. Biofilm detachment at .
(a) detachment cluster volume with time; (b) number of events with time; (c) distribution of detached cluster volume. The error bars show ±1 standard deviation calculated from five replicates. Results from all replicates are shown to demonstrate that they all follow the same trend.

