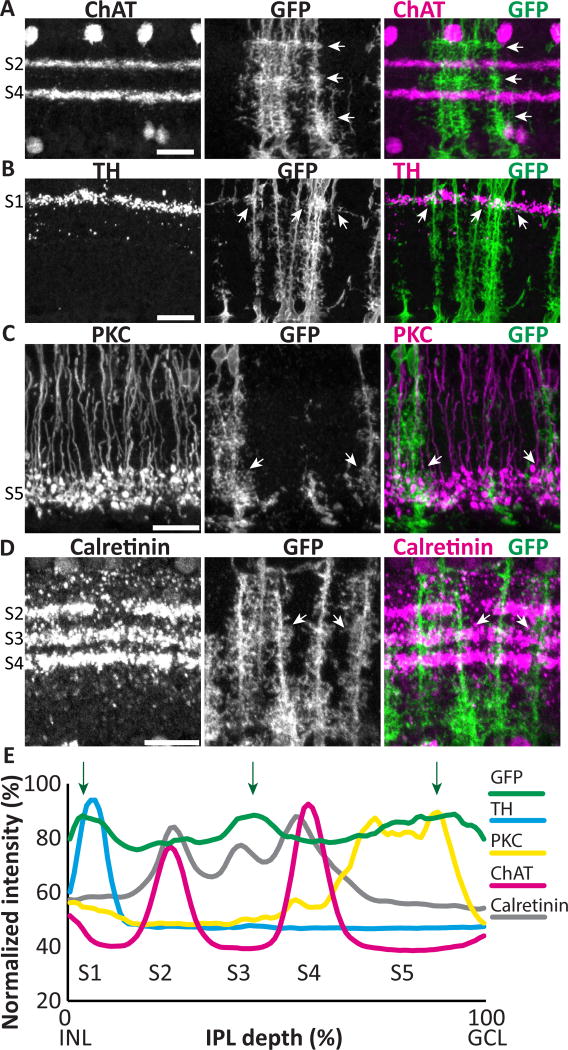
Figure 2. Müller glia branching patterns differ across IPL sublaminae.
Adult GLAST-CreER; mTmG retinal cross-sections co-stained for IPL sublaminar markers and anti- GFP to reveal MG. A) ChAT staining divides the IPL into 2 ChAT-positive sublayers (S2, S4, labeled at left) and 3 ChAT-negative layers (S1, S3, S5). mGFP-labeled MG processes have heterogeneous density across the IPL, with highest density in S1, S3, and S5 (arrows). B–D) Dense MG arbors in S1, S3, and S5 co-localize with distinct classes of neurons: dendrites of TH-positive dopaminergic amacrine cells in S1 (B); axon terminals of PKC-positive rod bipolar cells in S5 (C); and dendrites of calretinin expressing neurons in S3 (D). Arrows show sites of colocalization. E) Quantification of fluorescence intensity by IPL depth for MG (GFP) (n = 31 measurements) and sublaminar neuronal markers. Müller branches are abundant across the entire IPL, but consistently show peaks in density in S1, S3, and S5 (arrows), which align with sublaminar marker peaks. Scale bars: 20 µm.

