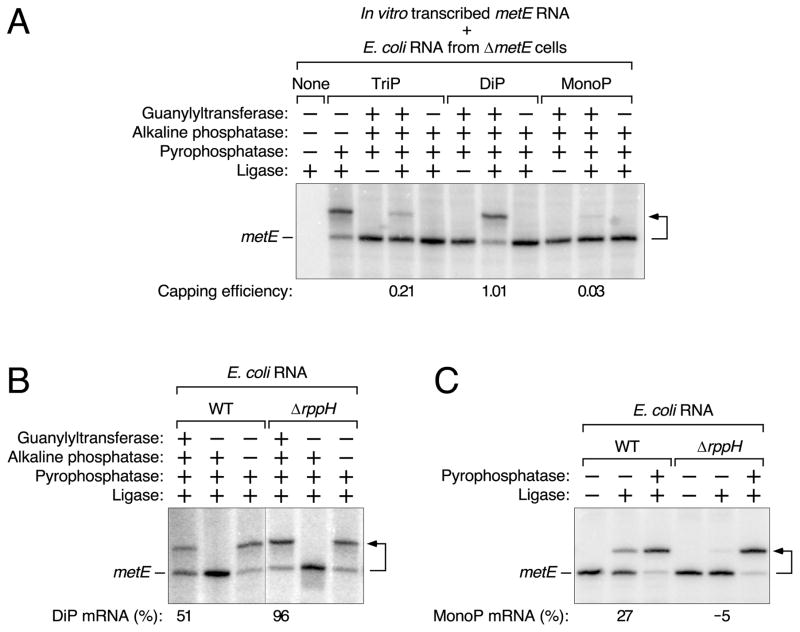
Figure 4. Detection of diphosphorylated metE mRNA in E. coli.
(A) Examination of in vitro transcribed metE standards bearing a 5′-terminal triphosphate (TriP), diphosphate (DiP), or monophosphate (MonoP) by PACO. The reactions were performed in the presence of total E. coli RNA from ΔmetE cells. See also Tables S2 and S3.
(B) Relative abundance of diphosphorylated metE mRNA in wild-type (WT) and ΔrppH cells, as determined by PACO. A vertical line marks the location of superfluous lanes omitted from the image. See also Tables S4 and S5.
(C) Relative abundance of monophosphorylated metE mRNA in wild-type (WT) and ΔrppH cells, as determined by PABLO. See also Tables S4 and S5 and Figures S1 and S3.
For a detailed explanation of how the values in panels A, B, and C were calculated, see STAR Methods. Minor discrepancies versus the theoretical maximum (100%) or minimum (0%) resulted from the small mathematical correction factors that were used and are either within the margin of error or close to it. A bent arrow leads from each RNA substrate to its ligation product.

