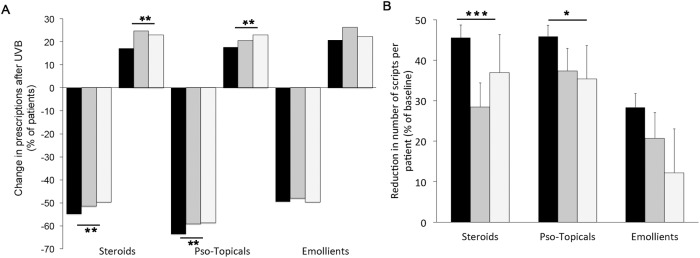
Fig 4. The change in psoriasis-specific drug prescribing before vs. after NB-UVB phototherapy in patients achieving different clinical outcomes.
A. The percentage of patients in each outcome class showing either a decrease, or an increase in the number of prescriptions for each drug class indicated. Black columns: outcomes 0/1 (“clear”, “minimal residual disease”), dark grey: outcome 2 (“moderate clearance”), light grey: outcomes 3/4/5 (“minimal change”, “no change”, “worsening”). B The change in prescriptions made per patient, compared between after vs. before NB-UVB treatment (detailed in Table 3), expressed as percentage reduction compared to baseline, for each of the outcome classes, as in A. *** p < 0.0001, ** p < 0.001, * p < 0.01 (chi-square for the difference between the three outcome classes).

