
Fig 1. Plasma ACTH (A) and cortisol (B) levels of CON (open bars; n = 6) and MO (solid bars; n = 6) adult male F1 offspring at the initiation and the end of the feeding trial.
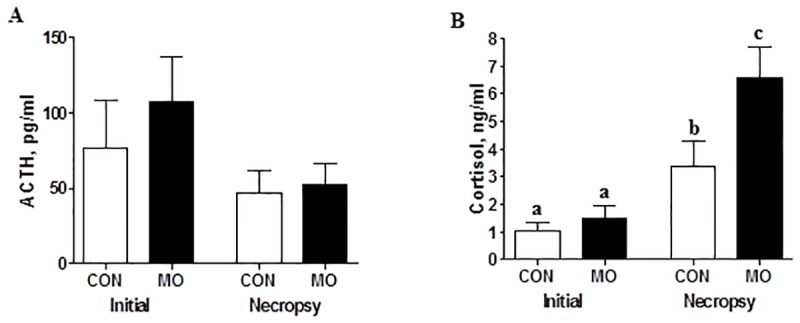
a,b,cMeans ± SEM with different superscripts differ, (P < 0.05).
Official websites use .gov
A
.gov website belongs to an official
government organization in the United States.
Secure .gov websites use HTTPS
A lock (
) or https:// means you've safely
connected to the .gov website. Share sensitive
information only on official, secure websites.
a,b,cMeans ± SEM with different superscripts differ, (P < 0.05).