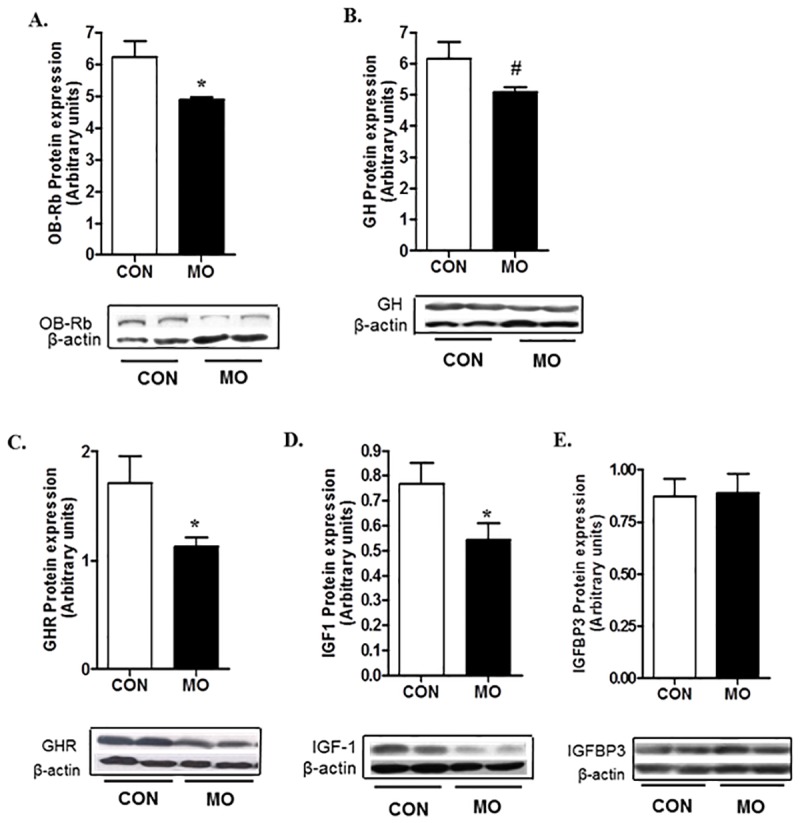
Fig 5. Protein expression of OB-Rb (A), and GH (B) in pituitary, and GHR (C), IGF1 (D), and IGFBP3 (E) in liver samples of CON (open bars, n = 6) and MO (solid bars; n = 6) adult male F1 offspring.

*Means ± SEM differ, (P < 0.05). #Means ± SEM tended to differ, (P < 0. 10).
