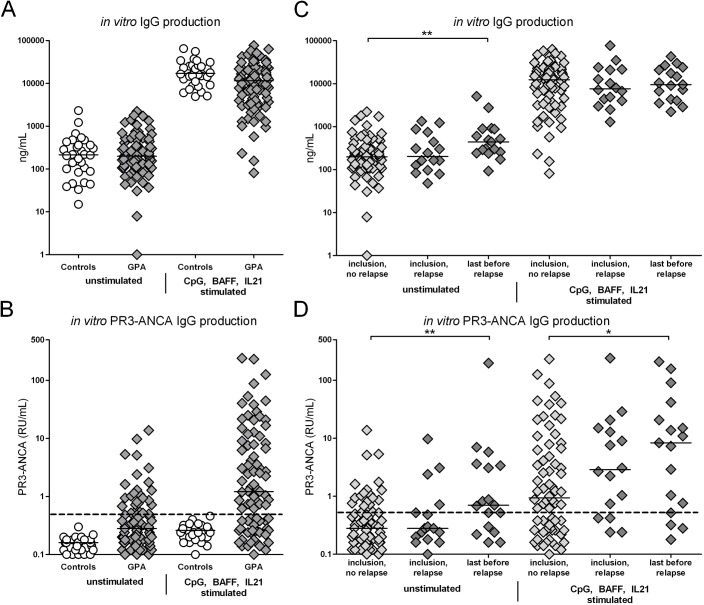
Fig 1. In vitro total and PR3-ANCA specific IgG production.
Levels of A) total IgG and B) PR3-ANCA specific IgG production were determined in in vitro culture supernatant samples from 84 GPA patients and 32 healthy controls at time of inclusion. C-D) The GPA patients were divided based on future relapse. Results at time of inclusion from patients with and without relapse during follow-up and the last sample taken before relapse are depicted. The PR3-ANCA IgG levels in healthy controls were very low and considered to be negative. The dashed line represents the positive cut-off, based on the mean of the healthy control samples + 3 times the standard deviation. Horizontal lines represent median values. *p<0.05. **p<0.01.

