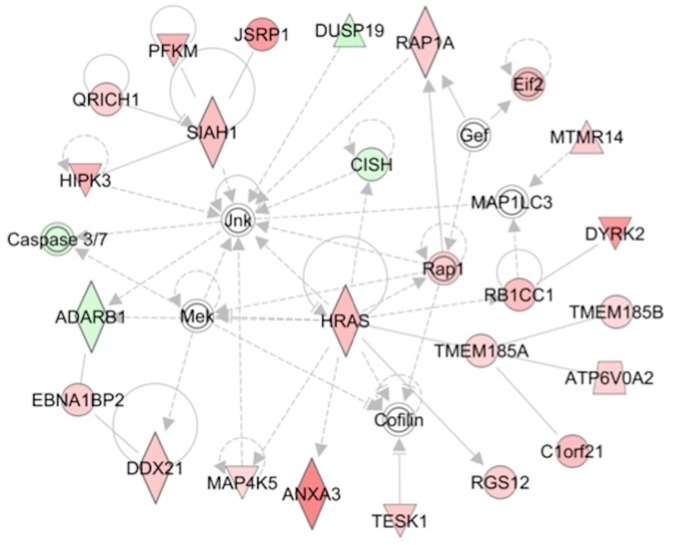
Fig 1. Ingenuity Pathway Analysis (IPA) identifies a network enriched in differentially expressed genes (DEGs).
The inter-relationship of DEGs identified as part of a gene network related to organismal injury and skeletal and muscular disorders (Network 4 in Table 3) is depicted visually. Genes exhibiting differential expression in skeletal muscle of cases versus controls are denoted in green (lower expression in cases) and pink/red (higher expression in cases). Regulatory molecules shared by genes within each network some of which are DEGs and some are not are identified as "hubs". Solid lines denote positive interaction and dashed lines inhibitory influences. Genes denoted by circles represent other proteins, triangles represent kinases, inverted triangles represent phosphatases, and diamonds represent enzymes.

