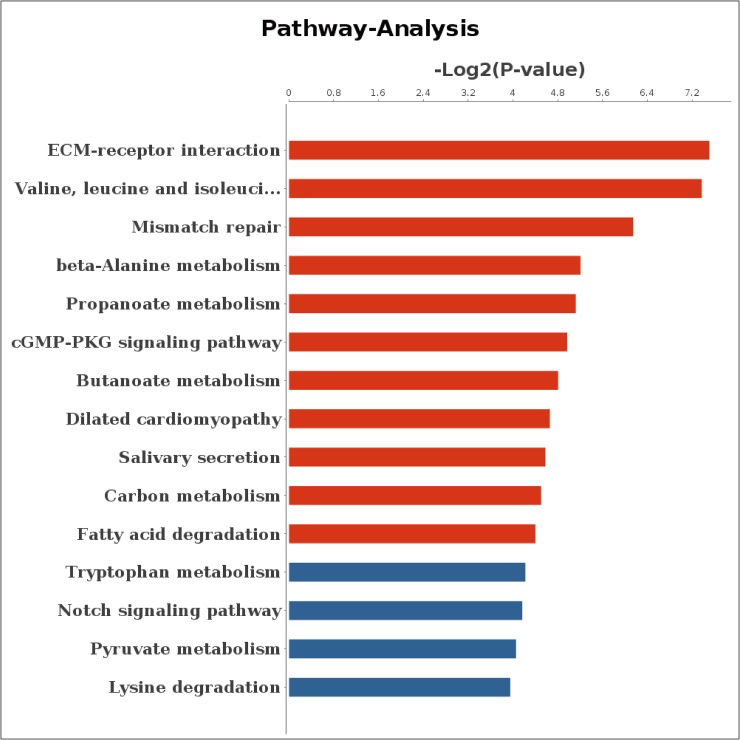
Fig 7. Pathway enrichment of DEGs with expression level negatively correlated with DMRs methylation level.
Abscissa represents the value of log2 (p value) and ordinate represents the pathway name; Red bars indicate corrected p< 0.05. DMRs: differentially methylated regions; DEGs: differentially expressed genes.

