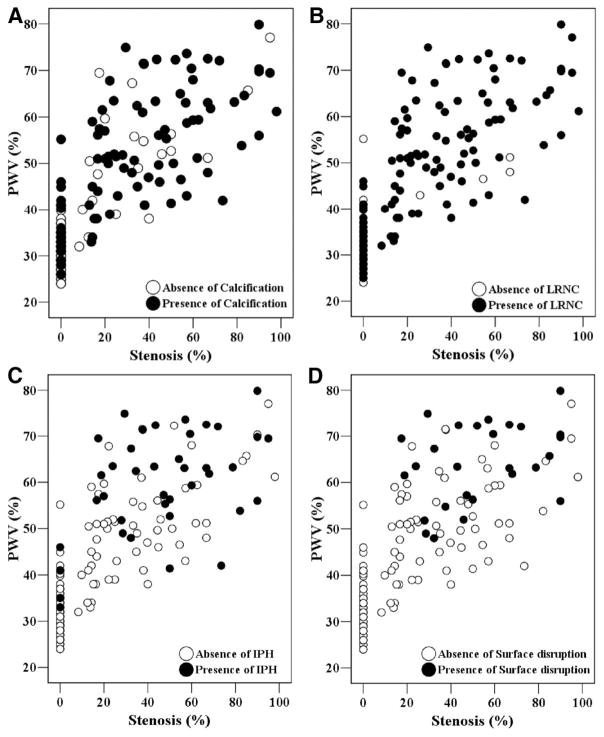
Figure 2.
Scatter plots represent a general linear correlation between percent wall volume (PWV) and stenosis. However, there is a wide spectrum of PWV at each level of stenosis. Points labeled according to the presence or absence of calcification (A), LRNC (B), IPH (C), or surface disruption (D) indicate that each plaque feature occurred across a range of both PWV and stenosis. Notice that each compositional feature occurs across the full range of stenosis and PWV, with the exception of surface disruption.

