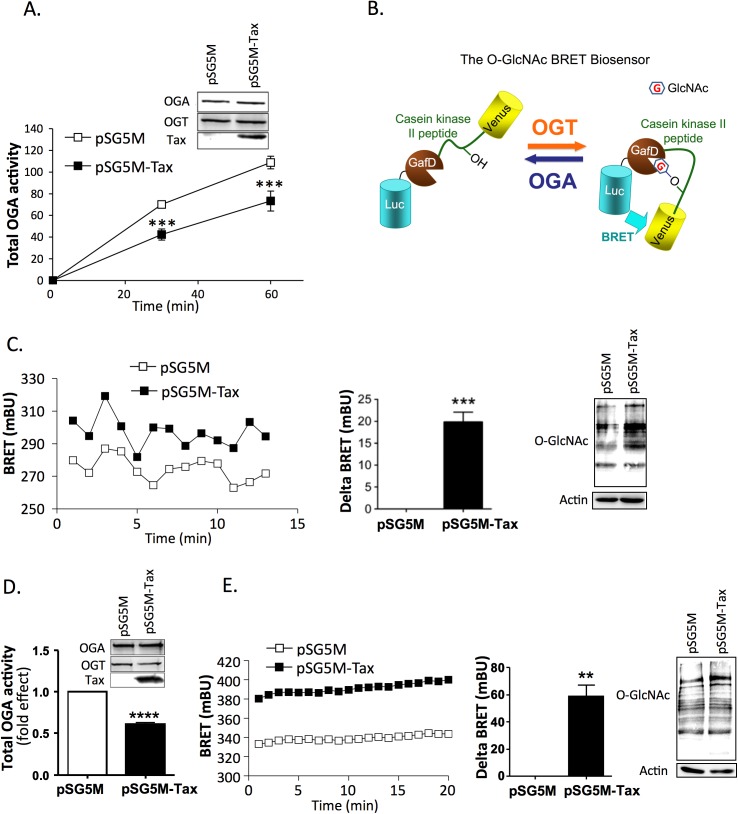
Fig 2. Effect of Tax on OGA activity and O-GlcNAcylation.
(A) Total OGA activity was measured at two different time-points in extracts from TL-om1 T cells transfected with either the control or Tax plasmid. Results are means ± SEM of 4 independent experiments. The insert shows the expression of OGA, OGT and Tax in the cell extracts. (B) The BRET O-GlcNAc-biosensor is composed of Rluc8 fused to the fimbrial adhesin lectin domain GafD, a known OGT substrate peptide derived from casein kinase II placed between two flexible linkers (GGSGG), followed by the Venus variant of the yellow fluorescent protein (Adapted from [27]). (C) TL-om1 cells were transfected with the O-GlcNAc BRET biosensor and either the control or Tax plasmid. BRET experiments were performed 24h after transfection. BRET measurements were started 5 min after the addition of coelenterazine. Left panel: typical BRET experiment. Middle panel: mean delta BRET (increased BRET signal induced by Tax expression). Results are means ± SEM of 3 independent experiments. Right panel: level of O-GlcNAc proteins evaluated by western-blotting with an anti-O-GlcNAc antibody. (D) Total OGA activity was measured in extracts from HEK-293T cells transfected with either the control or Tax plasmid. Cells were extracted and OGA activity was measured at 30 min. Results are means ± SEM of 3 independent experiments. The insert shows the expression of OGA, OGT and Tax in the cell extracts. (E) HEK-293T cells were transfected with the O-GlcNAc BRET biosensor and either the control or Tax plasmid. BRET experiments were performed 48h after transfection. BRET measurements were started 5 min after the addition of coelenterazine. Left panel: typical BRET experiment. Middle panel: mean delta BRET (increased BRET signal induced by Tax expression). Results are means ± SEM of 3 independent experiments. Right panel: level of O-GlcNAc proteins evaluated by western-blotting with an anti-O-GlcNAc antibody. Statistical significance was calculated using the student’s t test (**: p<0.01; ***: p<0.001; ****: p<0.0001).

