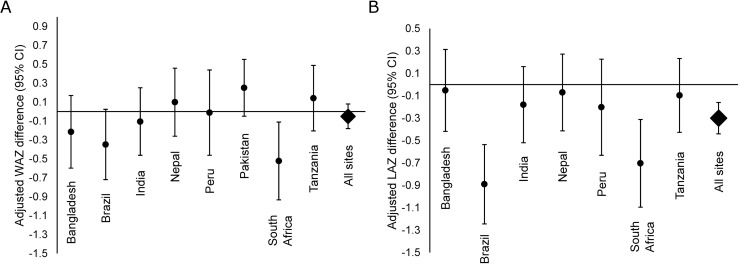
Fig 3. Long-term growth.
Adjusted site-specific association between EAEC detection in monthly surveillance stools and A: weight-for-age z-score (WAZ) and B: length-for-age z-score (LAZ) at two years of age among 1,727 children in the MAL-ED cohort who had anthropometric measurements at two years. Estimates are the z-score difference associated with a high frequency of EAEC detection compared to a low frequency of EAEC detection. Definitions for high and low frequency are based on the 10th and 90th percentiles of stool positivity in the cohort. Low: ≤11% of surveillance stools positive for EAEC; high: ≥50% of surveillance stools positive for EAEC.

