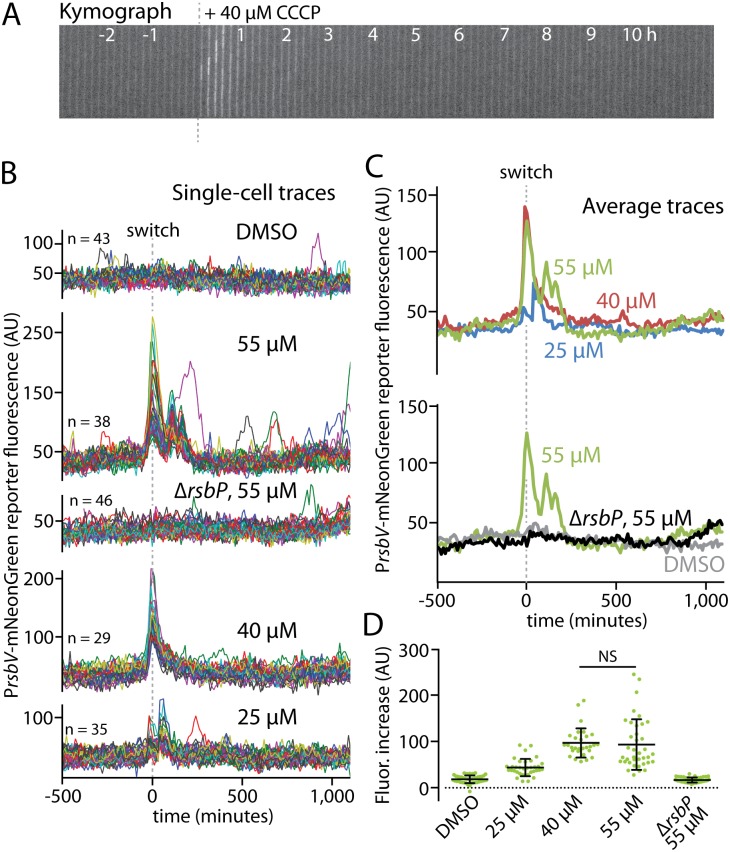
Fig 2. Energy stress elicits an amplitude-modulated response.
A. A kymograph is shown of an MTC1801 cell lineage growing in a microfluidic channel before and after the addition of 40 μM CCCP (dashed line) to induce energy stress via ATP depletion. B. Single-cell intensity traces of a stress-responsive PrsbV-mNeonGreen reporter before and after (dashed line) the addition of CCCP at the indicated concentrations. DMSO was used as a vehicle control for the medium switch, and a ΔrsbP mutant (MTC1906) controlled for non-energy-stress responses. The traces were manually curated to eliminate cell lineages with cell-death events or other anomalies; comparisons of mean traces for curated and uncurated populations are shown in S2 Fig. C. Overlaid average intensity traces of the cell populations in B, showing different CCCP concentrations (top) and the controls (bottom). D. Distributions of signal increases in single cells from before stress exposure to their maximal peak values. NS, not significant; all other pairwise comparisons (except for DMSO vs. ΔrsbP) were significant (p < 4 x 10⁻⁶).

