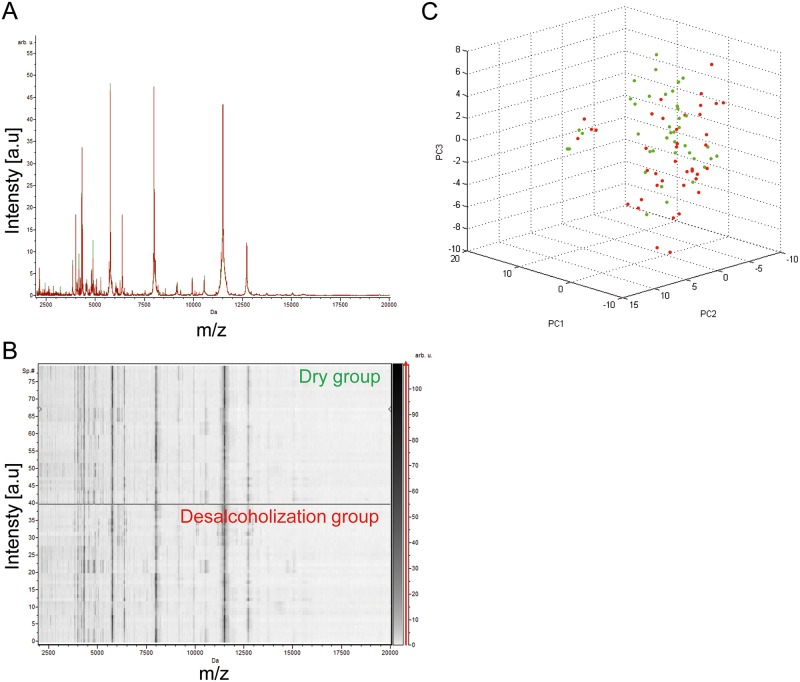
Fig 3. Comparison of MALDI-TOF MS spectra from legs of same tick between “de-alcoholization” and “dry” protocols.
Representation of MS profiles by the superimposition of average MS profiles from legs of ticks treated by “de-alcoholization” and “dry” protocols (A), or the gel view tool (B). Tick legs MS spectra from “dry” (green dots) and “de-alcoholization” (red dots) protocols were compared by Principal Component Analysis (C); a.u., arbitrary units; m/z, mass-to-charge ratio.

