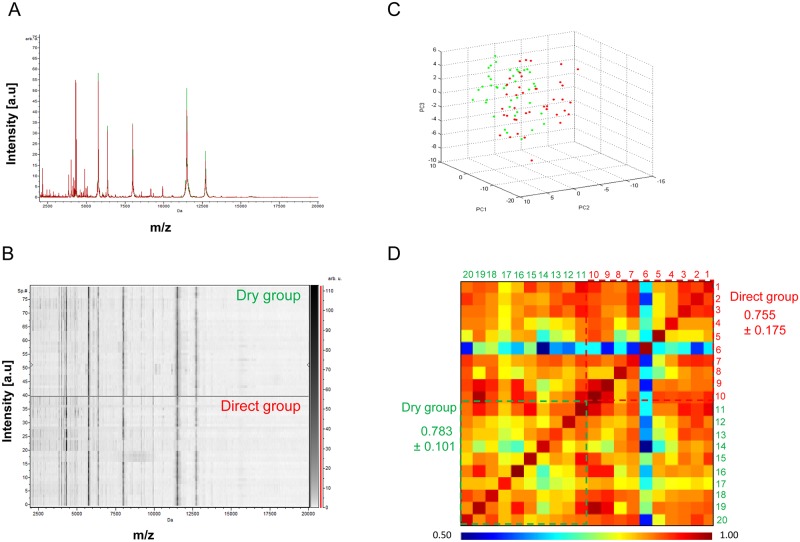
Fig 4. Comparison of MALDI-TOF MS spectra from legs of same tick using “dry” and “direct” protocol.
Representation of MS profiles by the superimposition of average MS profiles of “dry” and “direct” protocol (A), the gel view tool of “dry” and “direct” protocol (B) and comparison by Principal Component Analysis between “dry” and “direct” protocol (C). Assessment of spectra reproducibility for two protocols using composite correlation index (CCI) (D): The rainbow colours indicate the degree of similarity between pair mass spectra comparisons ranging from red (very similar) to blue (very dissimilar). The numbers 1 to 10 are tick numbers treated by “direct” protocol and 11 to 20 those treated by “dry” protocol.

