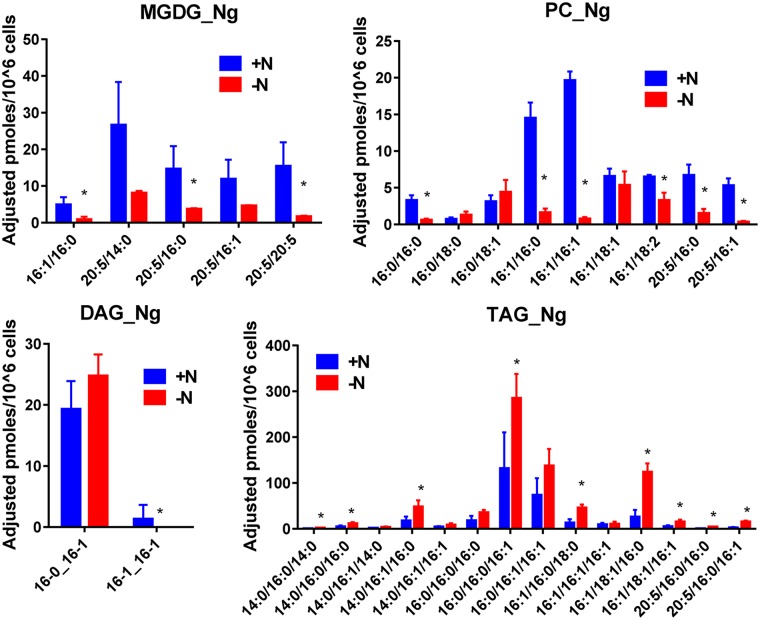
Fig 7. Impact of nitrogen starvation on the amount of the various molecular species constituting MGDG, PC, DAG and TAG in N.g..
Quantification were made by the LC-MS/MS method. Values are the average ± SD of three biological repeats. Significant differences (p ≤ 0.05) are indicated by an asterisk. Significant differences (P < 0.05) are shown by an asterisk and were calculated by an unpaired multiple t test using GraphPad Prism software.

