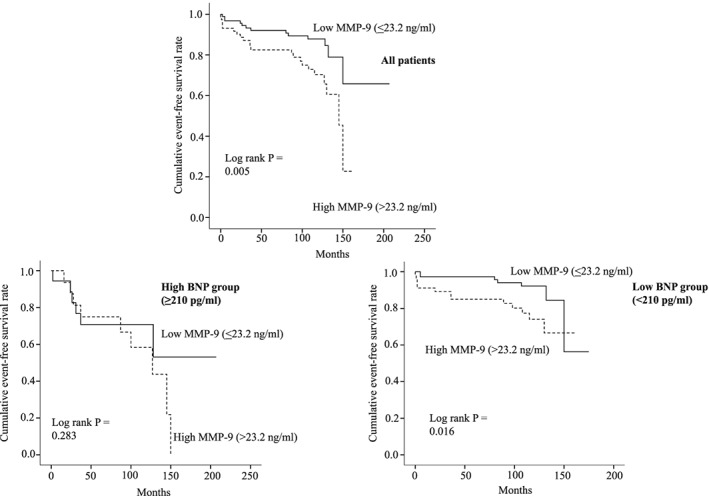
Figure 3.

Kaplan–Meier curves for HF events. Upper panel: All patients were stratified by MMP‐9. MMP‐9 ≤23.2 ng/mL (solid line) vs. MMP‐9 >23.2 ng/mL (broken line). Lower left panel: Patients in the high BNP group (BNP >210 pg/mL) were stratified into a low MMP‐9 group (≤23.2 ng/mL) (solid line) and a high MMP‐9 group (>23.2 ng/mL) (broken line). Lower right panel: Patients in the low BNP group (≤210 pg/mL) were stratified into a low MMP‐9 group (≤23.2 ng/mL) (solid line) and a high MMP‐9 group (>23.2 ng/mL) (broken line). BNP, brain natriuretic peptide; HF events, heart failure events; MMP, matrix metalloproteinase.
