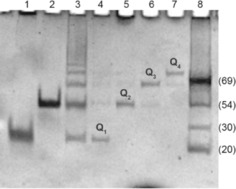
Figure 3.

Electrophoretic mobility of the ODNs under study annealed in 1.0 m K+ buffer. Lane 1: d(TGGGGT)4; lane 2: d(CGGTGGT)8; lane 3: ODN 1; lanes 4–7: isolated peaks from the HPLC‐SEC fractionation of annealed 1; lane 8: single‐stranded DNA reference ladder.
