Figure 1. Photo-crosslinking mapping of CRF1R to determine footprints of agonists and antagonists.
(A) Sequence alignment of CRF1R peptide ligands. The classification into N-terminus, C-terminus and helical connector is adopted from Beyermann et al. (2000). Antagonists derived from CRF are well characterized in the literature (Rivier and Rivier, 2014), while Ucn1(8-40) was introduced in this work for the first time for direct comparison of agonist/antagonist pairs. In dFXCRF(12-41), substitutions of the two native Met residues to Nle and the N-terminal D-amino acid to enhance its stability and potency (Rivier and Rivier, 2014). (B–D) Activation of CRF1R by CRF and Ucn1 in the presence and absence of competitive antagonists. The assay measures cAMP accumulation in live HEK293 cells stimulated with serial dilutions of each ligand via a luciferase reporter. Plots are representative mean ± s.e.m. of at least three independent experiments, each run in triplicates. (B) CRF1R activation elicited by each of the ligands used in this study. Sub-nanomolar EC50 values for the two agonists CRF and Ucn1 agree with literature data (Rivier and Rivier, 2014). As expected, dFXCRF(12-41) did not elicit any significant receptor activation up to the maximal tested concentration of 100 nM, while CRF(9-41) and Ucn1(8-40) showed minimal residual activity (<10%). (C, D) CRF1R activation by either CRF or Ucn1, in the presence of a constant concentration of each of the antagonists used in this study. (E) Photo-crosslinking experiments. Transiently transfected 293T cells expressing each Azi-CRF1R mutant (residues replaced by Azi are indicated in the upper row) were incubated with each of the five peptide ligands indicated in the right column, followed by UV irradiation (365 nm). Whole-cell lysates were separated on 10% SDS-PAGE and analyzed by Western blotting using either anti-CRF or anti-Ucn1 antibodies as indicated. To obtain sharper bands, samples were deglycosylated by PNGaseF. The subdivision of transmembrane helices and ECLs is based on the crystal structure of the CRF1R TMD (Hollenstein et al., 2013). The deglycosylated ligand-CRF1R complex runs at an apparent MW of ~40 kDa (Coin et al., 2013). The non-crosslinked ligand is not detected (MW ~3–4 kDa).
DOI: http://dx.doi.org/10.7554/eLife.27711.002

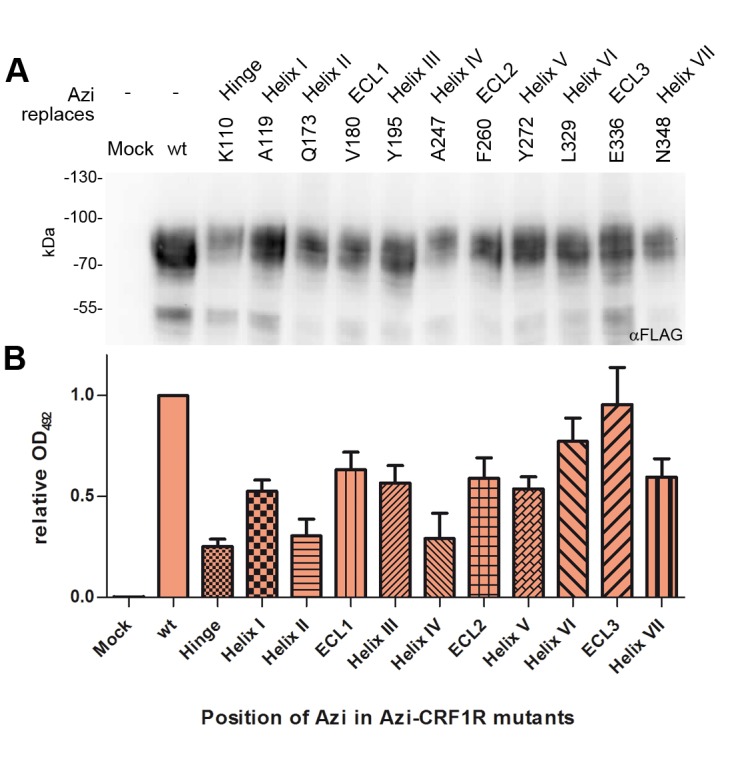
Figure 1—figure supplement 1. Expression profiles of a subset of Azi-CRF1R mutants.