. 2017 May 15;6:e24560. doi: 10.7554/eLife.24560

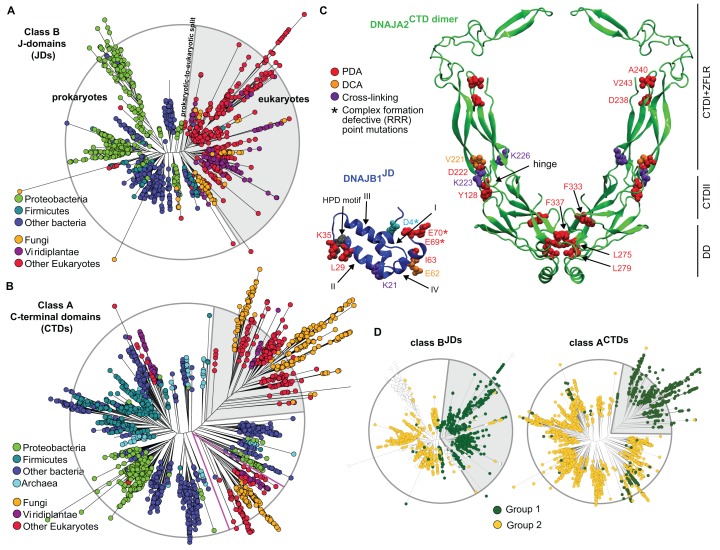
Figure 2. Phylogenetic and coevolutionary analyses of the JD-CTD interaction between class A and B J-proteins.

(A) Phylogenetic tree of class B J-domains. Color-coding separates different phylogenetic groups. Grey area highlights the separation of eukaryotes (fungi, viridiplantae and other eukaryotes) from prokaryotes (proteobacteria, firmicutes and other bacteria) and Archaea. (B) As in (A), phylogenetic tree of class A CTDs. Pink lines delimit organellar sequences of eukaryotic organisms. (C) Structural view of most discriminating positions predicted by PDA (red) plotted on JD of DNAJB1 (blue, five positions) and CTD of DNAJA2 (green, nine positions). DCA-derived coevolving residue pairs depicted on DNAJB1JD and DNAJA2CTD (orange). Experimentally determined cross-linking residues between DNAJB1 and the DNAJA2 are indicated in purple (Nillegoda et al., 2015). Location of the triple charge reversion (E/D→R) mutations that disrupts interclass J-protein complex formation between DNAJB1 and DNAJA2 denoted by (*) (Nillegoda et al., 2015). The HPD motif of DNAJB1JD is shown in grey. Roman numerals show the four α-helices on JD. (D) Mapping of sequence clustering derived from PDA (see Materials and methods) using the most discriminating positions on to JD and CTD trees of class B and class A J-proteins, respectively. The two identified groups (green and yellow nodes) covered 81% in the case of the clustering done on the JDs and 100% when clustering was done on the CTDs. Unclassified sequences are depicted in white.

DOI: http://dx.doi.org/10.7554/eLife.24560.007

Figure 2.

Figure 2—figure supplement 1. Phylogenetic and coevolutionary analyses between class AJDs and class BCTDs.

Figure 2—figure supplement 1.

(A) Phylogenetic tree built from the J-domains of class A J-proteins. Color-coding separates different phylogenetic groups. Grey area highlights the separation of eukaryotes (fungi, viridiplantae and other eukaryotes) from prokaryotes (proteobacteria, firmicutes and other bacteria) and Archaea. (B) As in (A), built from the CTDs of class B J-proteins. Pink lines delimit organellar sequences of eukaryotic organisms. (C) Structural view of PDA predicted most discriminating positions (red) plotted on the JD of DNAJA2 (green, six positions) and the CTD of DNAJB1 (blue, nine positions). DCA derived coevolving residue pairs depicted on DNAJB1JD and DNAJA2CTD (orange). Experimentally determined cross-linking residues between the DNAJA2JD and the DNAJB1CTD are indicated in purple (Nillegoda et al., 2015). Location of the triple charge reversion (E/D→R) mutations that disrupts interclass J-protein complex formation between DNAJB1 and DNAJA2 denoted by (*) (Nillegoda et al., 2015). The HPD motif of DNAJB1JD is shown in grey. (D) Mapping of sequence clustering derived from PDA (see Materials and methods) using the most discriminating positions on to JD and CTD trees of class A and class B J-proteins, respectively. The two identified groups (green and yellow nodes) covered 78% in the case of the clustering done on the JDs and 100% when clustering was done on the CTDs. Unclassified sequences are depicted in white. (E) Graph showing the distribution of predicted DCA pairs between class BJDs and class ACTDs. The threshold for obtaining statistically significant inter-protein coevolving pairs was set at 5% of contact appearance after 300 realizations. DCA-derived coevolving residue pair on DNAJA2JD and DNAJB1CTD (orange). Neighboring charged residues are depicted in black. (F) As in (E) graph showing the distribution of predicted DCA pairs between class AJDs and class BCTDs.
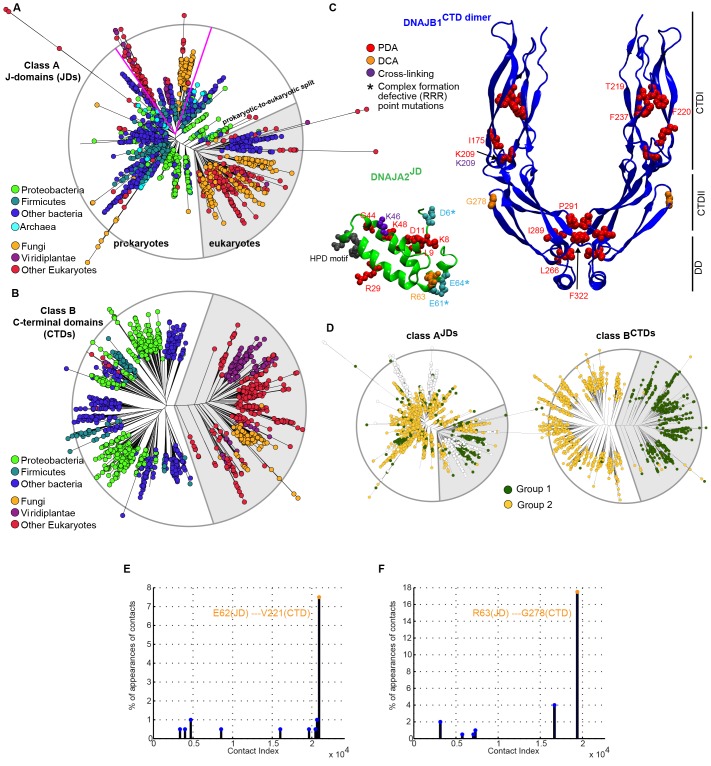
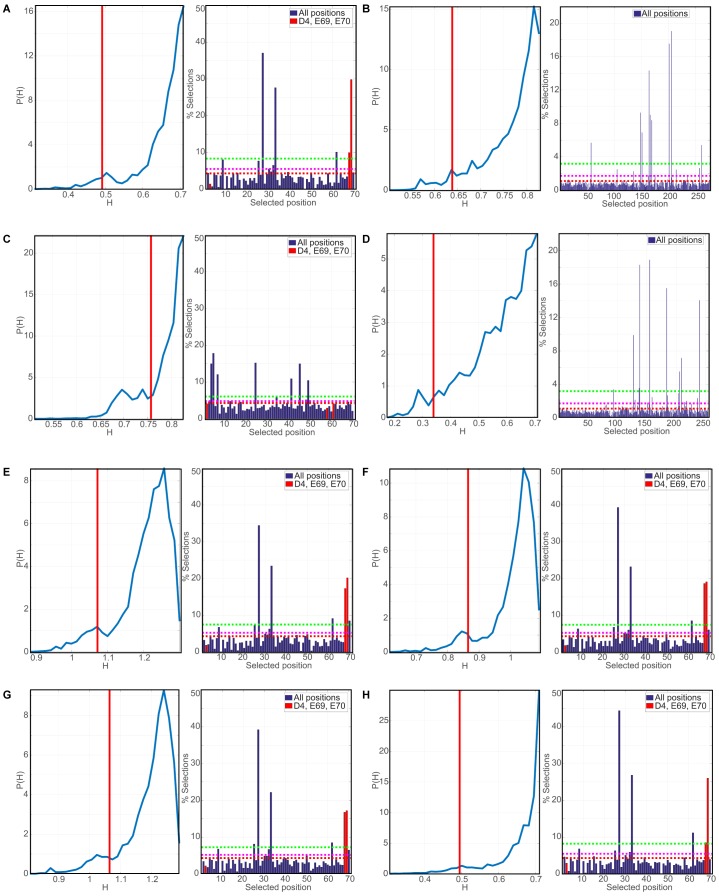
Figure 2—figure supplement 2. Evaluation of robustness in Phylogenetic Discriminant Analysis.

Figure 2—figure supplement 2.

In all right sub-panels, the numbering corresponds to the indexing of the MSAs and not of individual sequences. The red vertical red lines indicate the mixing score of the reference triplet (D6, E61, E64 for DNAJA2; D4, E69, E70 for DNAJB1) for the J-domains and the 5th percentile for the CTDs, which lack a reference triplet. In all right panels, the dashed red lines mark the mean selection rate of the null model, while the magenta (resp. green) dashed lines mark 3 (resp. 10) standard deviations of the mean selection rate (See Materials and methods). (A) PDA derived p-value and top positions for class B JDs. Left: Distribution of the mixing scores H (entropy) indicative of discriminatory power, the lower H the greater the discriminatory power (see Materials and methods). Right: Histogram of the percentage of appearances of positions in triplets having a lower mixing score H than the reference triplet (positions indicated in red). (B) as in (A) PDA-derived p-value and top positions for class A CTDs. The vertical red line marks the mixing score limiting the 5th percentile. (C) PDA derived p-value and top positions for class B JDs. (D) PDA derived p-value and top positions for class B CTDs. (E) Robustness analysis of PDA of class B JDs. Included groups: Other prokaryotes, other eukaryotes, fungi, and proteobacteria. (F) Robustness analysis of PDA of class B JDs. Included groups: Other prokaryotes, other eukaryotes, fungi, proteobacteria and firmicutes. (G) Robustness analysis of PDA of class B JDs. Included groups: Other prokaryotes, other eukaryotes, fungi, proteobacteria, firmicutes and viridiplants. (H) Robustness analysis of PDA of class B JDs using Modularity Clustering method.