. 2017 May 15;6:e24560. doi: 10.7554/eLife.24560

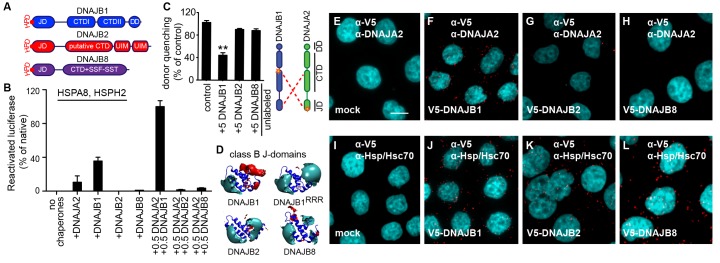
Figure 5. A naturally occurring discriminatory strategy correctly pairs J-proteins for specialized functions in eukaryotes.

(A) Structural organization of canonical (DNAJB1) and non-canonical (DNAJB2 and DNAJB8) members of the class B J-protein subfamily. (B) Reactivation of aggregated luciferase by the human Hsp70-based disaggregase system with canonical and non-canonical J-proteins under saturating chaperone levels. n = 3. See Materials and methods for protein concentrations used. (C) Competition of unlabeled DNAJB1, DNAJB2 and DNAJB8 for the JD-CTD interaction between DNAJB1 and DNAJA2 analyzed by FRET. Bars represent donor quenching efficiency of JD and CTD intermolecular interactions. Cartoon shows fluorophore positions mapped onto DNAJB1 and DNAJA2 protomers. Red dotted lines indicate intermolecular JD-CTD bidirectional interactions. The N-terminus of DNAJA2JD and the C-terminus of DNAJB1CTD (at residue Cys278) were labeled with the acceptor fluorophore ReAsH and the donor fluorophore Alexa Fluor 488, respectively. n = 3. Two-tailed t-test **p<0.01. (D) Electrostatic isopotential contour maps (cyan + 1, red −1 kcal/mol/e) of the J-domains of DNAJB1, DNAJB2 and DNAJB8. DNAJB1RRR is the triple mutant of DNAJB1 (D4R, E69R, E70R) that fails to interact with opposite class CTDs (Nillegoda et al., 2015). (E–L) Interclass interactions between V5-DNAJB1 (control), V5-DNAJB2 and V5-DNAJB8 with either DNAJA2 (E–H) or Hsp70 (I–L) captured by PLA in HeLa cells. Red punctae reflect a single complex formation event between the indicated J-proteins. PLA controls for antibody specificities in mock transfected cells (E, I). Nuclei stained with DAPI (cyan). Scale bar = 10 μm. n (biological repeats) = 2. The Hsp70 antibody recognizes both human Hsp70 and Hsc70 variants.

DOI: http://dx.doi.org/10.7554/eLife.24560.016

Figure 5.

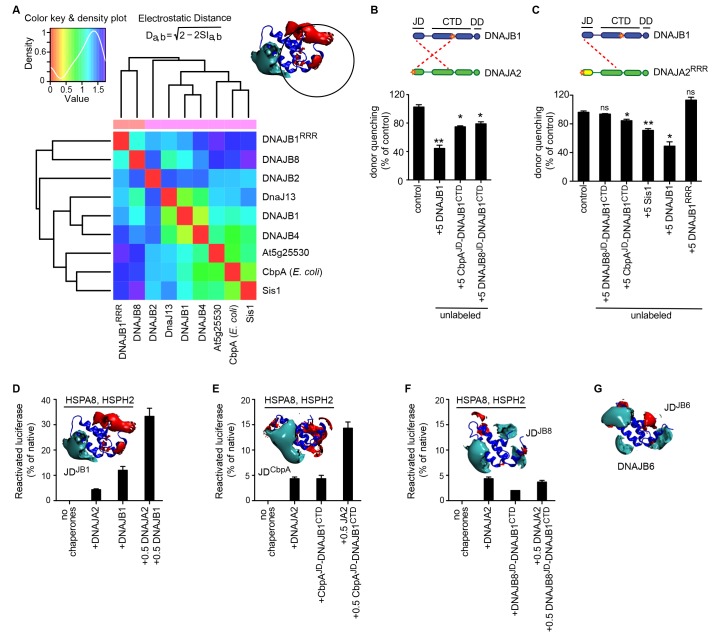
Figure 5—figure supplement 1. The J-domain of DNAJB8 is insufficient for interclass J-protein cooperation and disaggregation synergy.

Figure 5—figure supplement 1.

(A) Local PIPSA analysis results comparing the electrostatic potentials of eukaryotic class B JD in the region around α-helices I and IV and the mutated residues in DNAJB1RRR (inset, black circle indicating the spherical region analyzed in PIPSA). The JD from Escherichia coli (P36659, CbpA) was included as a control. The electrostatic potentials were clustered by similarity using Ward’s clustering. The heat maps show clustering of J-proteins by similarity (higher similarity indicated by a red shift). (B) FRET assays measuring the competition of wild-type DNAJB1 or J-domain chimeras of DNAJB1 with the JD-CTD interaction between DNAJB1 and DNAJA2. Bars represent donor quenching efficiency of JD and CTD intermolecular interactions. Cartoons above graph show fluorophore positions mapped onto DNAJB1 and DNAJA2 protomers. Red dotted lines indicate intermolecular JD-CTD bidirectional interactions. n = 3. Two-tailed t-test *p<0.05, **p<0.01, ns = not significant. (C) As in (B), FRET assays measuring the competition of wild type DNAJB1, Sis1, DNAJB1RRR or J-domain chimeras of DNAJB1 with the JD-CTD interaction between DNAJB1 and DNAJA2RRR. RRR denotes J-domain charge reversal mutations D4R, E69R, E70R for DNAJB1 and D6R, E61R, E64R for DNAJA2. n = 3. (D–F) Disaggregation/refolding of heat aggregated luciferase by human HSPA8-HSPH2 chaperone system containing DNAJB1, CbpAJD(E. coli)-DNAJB1CTD and DNAJB8JD-DNAJB1CTD. Interclass J-protein combinations are generated with class A J-protein DNAJA2. Inset, electrostatic isopotential contour maps of JDs of DNAJB1, E coli CbpA and DNAJB8 (cyan + 1, red −1 kcal/mol/e). n = 3. Error bars reflect mean ± sem. See Methods for protein concentrations used. (G) Electrostatic potential of the J-domain of human DNAJB6.