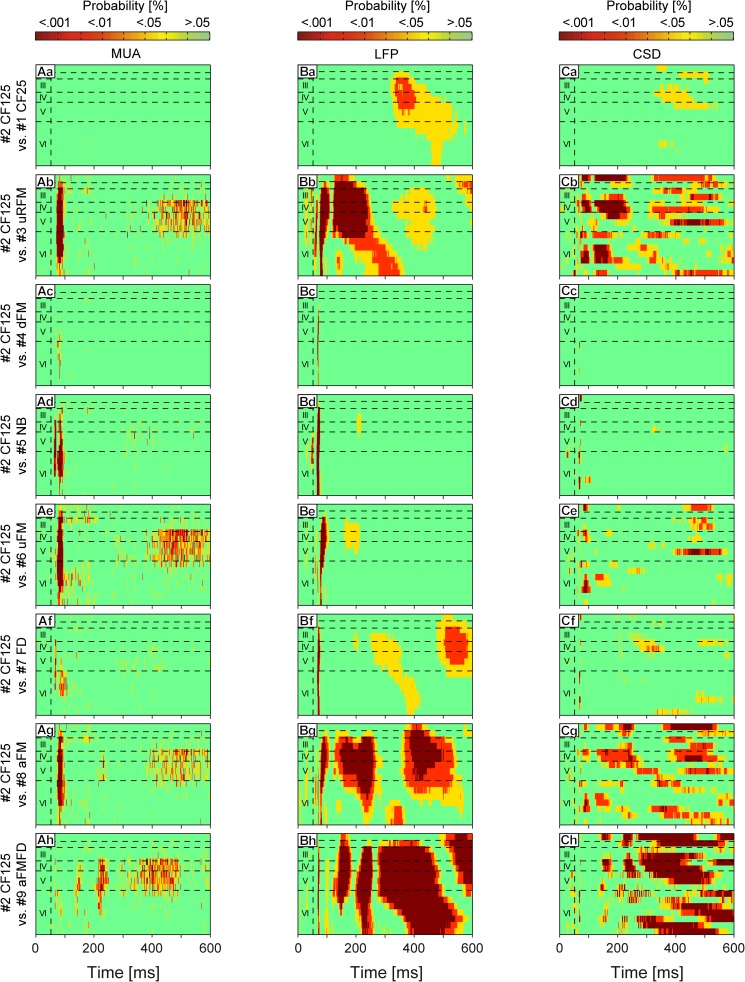
Fig 4. Statistical comparison between laminar MUA, LFP, and CSD profiles.
A parametric repeated measures ANOVA in combination with a false discovery rate post-hoc test was applied for 61 measurement points at each of the 600 time points and all 16 channels of the MUAs (Aa-Ah); the LFPs (Ba-Bh), and the CSDs (Ca-Ch). The profile evoked by stimulus #2 CF125 was set as control and tested against all remaining profiles. The points in the profiles represent the probability values (green: p ≥ 0.05; yellow: p < 0.05; red: p < 0.01; dark red: p < 0.001). Horizontal dashed lines indicate layer borders while the vertical dashed line marks the beginning of stimulation.

