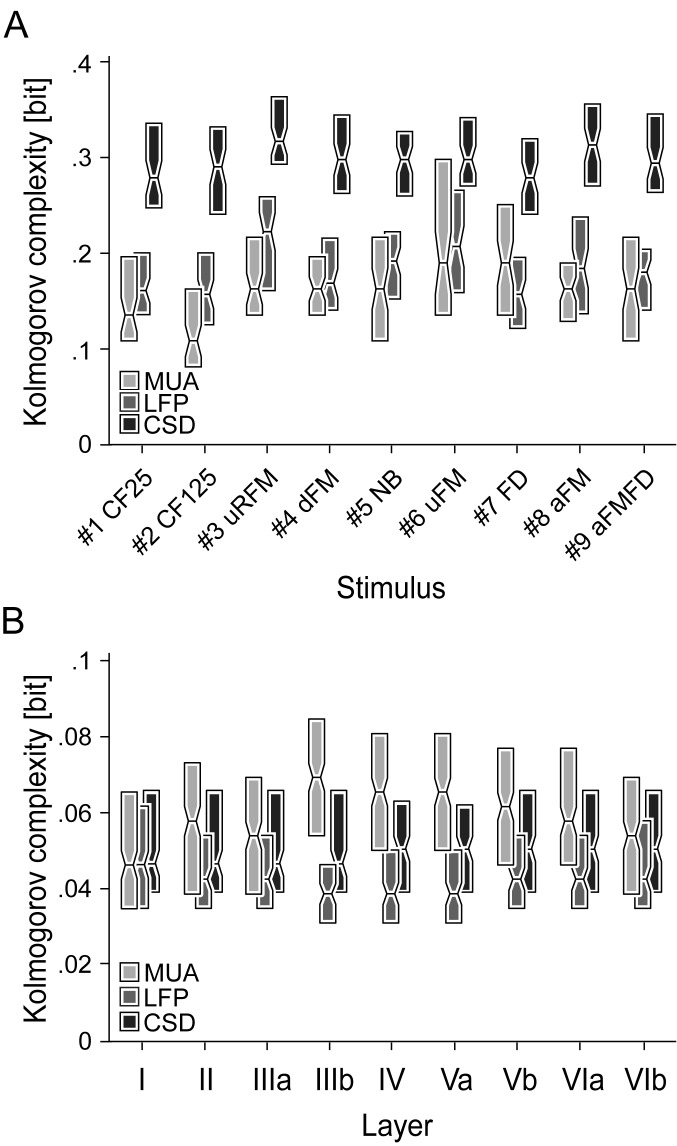
Fig 6. Kolmogorov complexity of layer-specific waveforms and laminar LFP, CSD, and MUA profiles.
The Kolmogorov complexity indicating the compressibility of binary data is shown as color-coded boxplots for each stimulus (A) or layer (B). In (B) the responses to all stimuli at each layer were pooled together. Edge of box represents second and fourth quartiles and midline represents median of data. Binary transformation border was set at 0 for LFP and CSD waveforms and at two times the individual median for MUA waveforms. The stimulus-specific Kolmogorov complexity is highest for CSD profiles indicating a high structural complexity. The expectedly overall lower Kolmogorov complexity for stimulus-unspecific single layer waveforms is comparable in layers I-IIIa, but ranks as MUA > CSD > LFP in the remaining layers IIIb-VIb.

