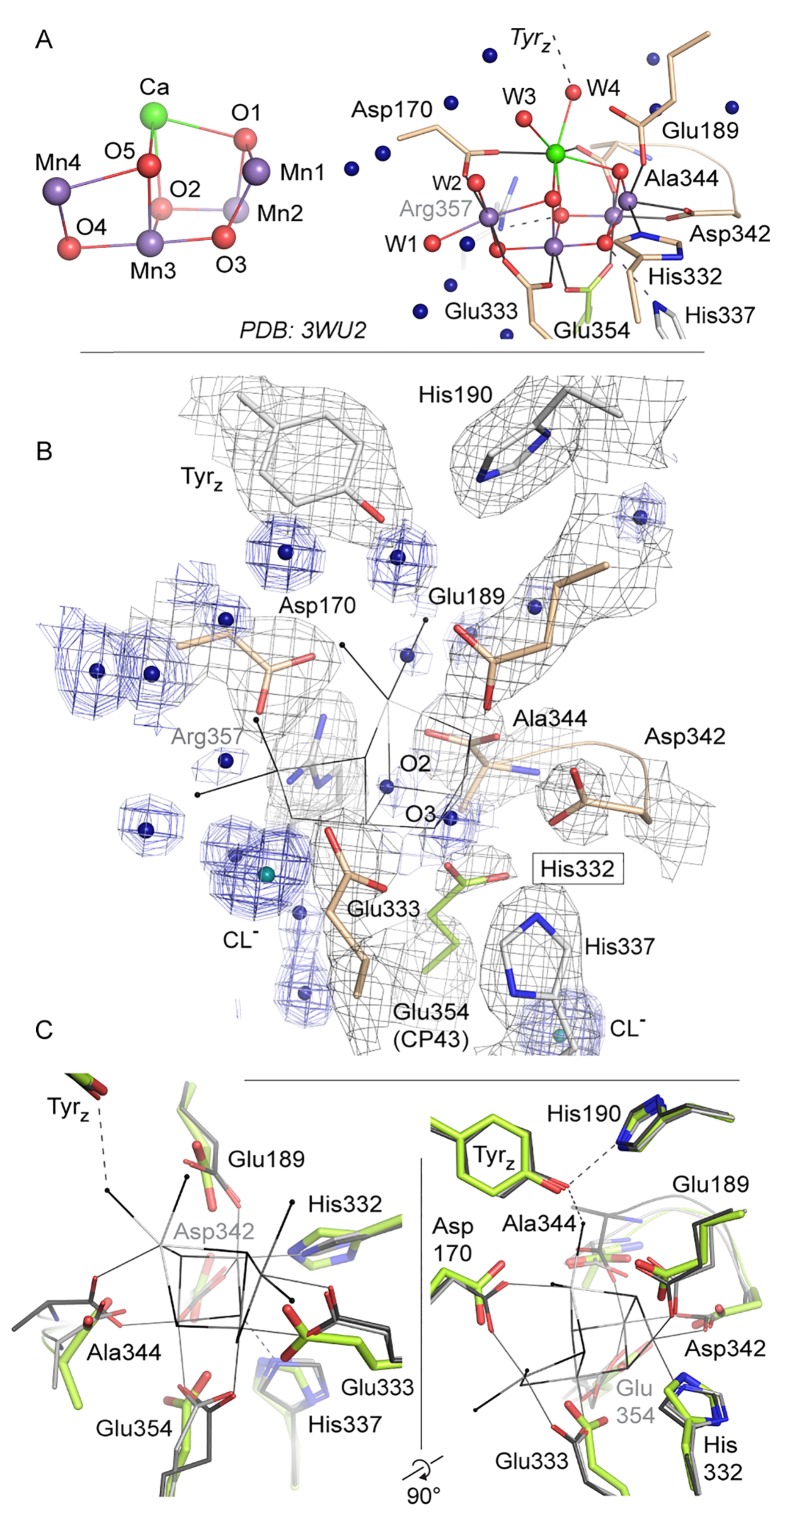
Figure 4. Comparison of intact WOC site and Mn-depleted site.
(A) Coordination of the intact WOC by side chains from the D1 subunit (cream) and CP43 (green) and four water molecules (W1–W4). Arg357(CP43) and His 337(D1) form hydrogen bonds to WOC oxygen atoms (Umena et al., 2011). (B) Model of sidechains and electron density map (1 sigma 2Fo-Fc, grey) of the apo-WOC and electron density (0.8–1.5 sigma 2Fo-Fc, blue) tentatively modeled as waters at the site of the WOC and surrounding water molecules (blue). Multiple contour lines indicate a stronger (more defined) peak in the electron density map (e.g. waters at Asp170), while fewer lines show a weaker signal (e.g. the water at the WOC O2 site). (C) Overlay of apo-WOC model (green) with two holo-PSII models at a similar (PDB: 4PJ0, [Hellmich et al., 2014], light grey) and higher resolution (PDB: 3WU2, [Umena et al., 2011], dark grey).
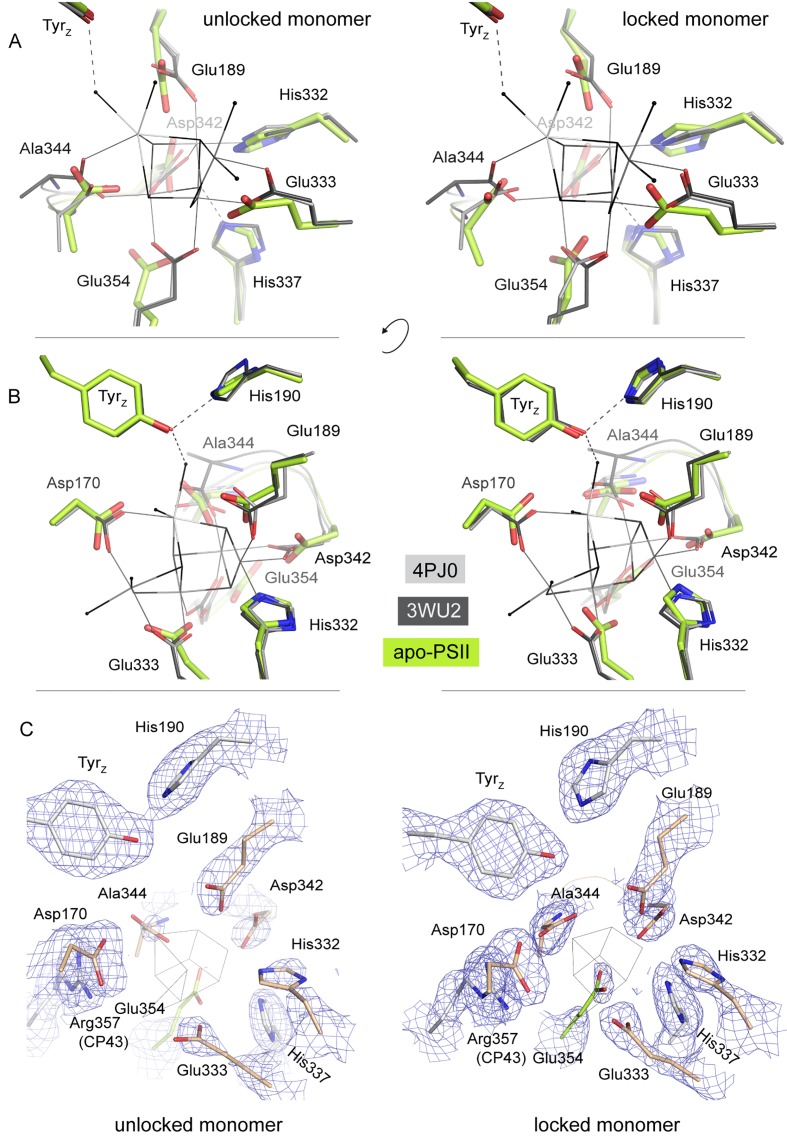
Figure 4—figure supplement 1. Overlay of the WOC-coordinating side chains at both monomers of dPSIIcc.
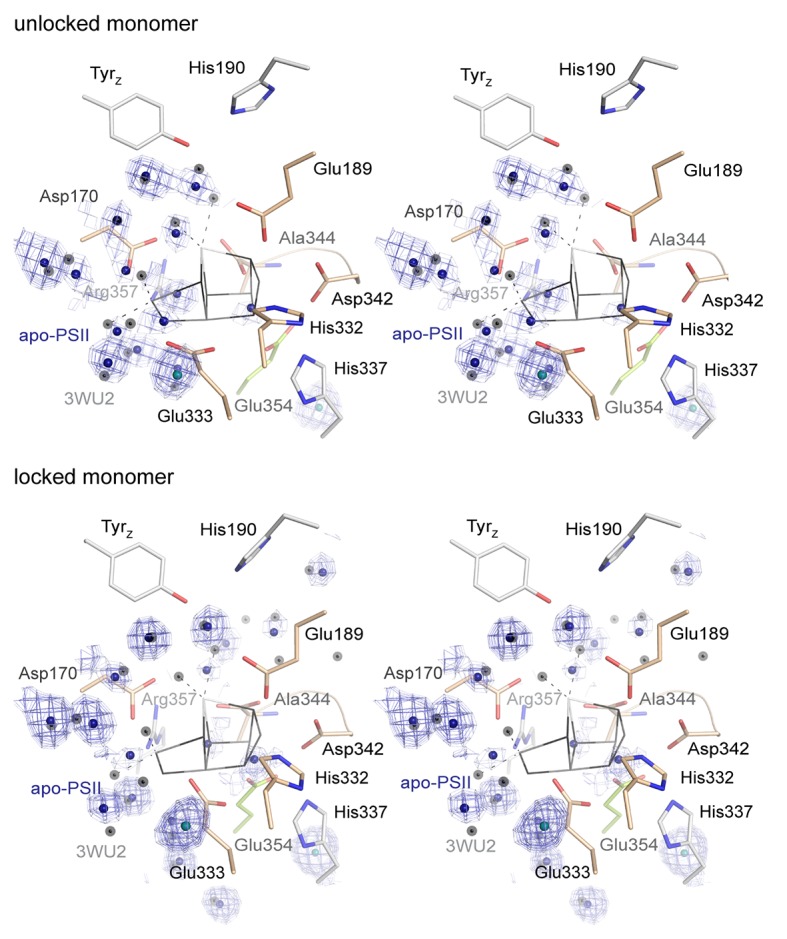
Figure 4—figure supplement 2. Stereo view of the WOC binding site as shown in Figure 4 but with the 0.8–1.5 σ 2Fo-Fc electron density map (blue) shown at water positions (blue spheres) and chloride positions (emerald spheres) only.

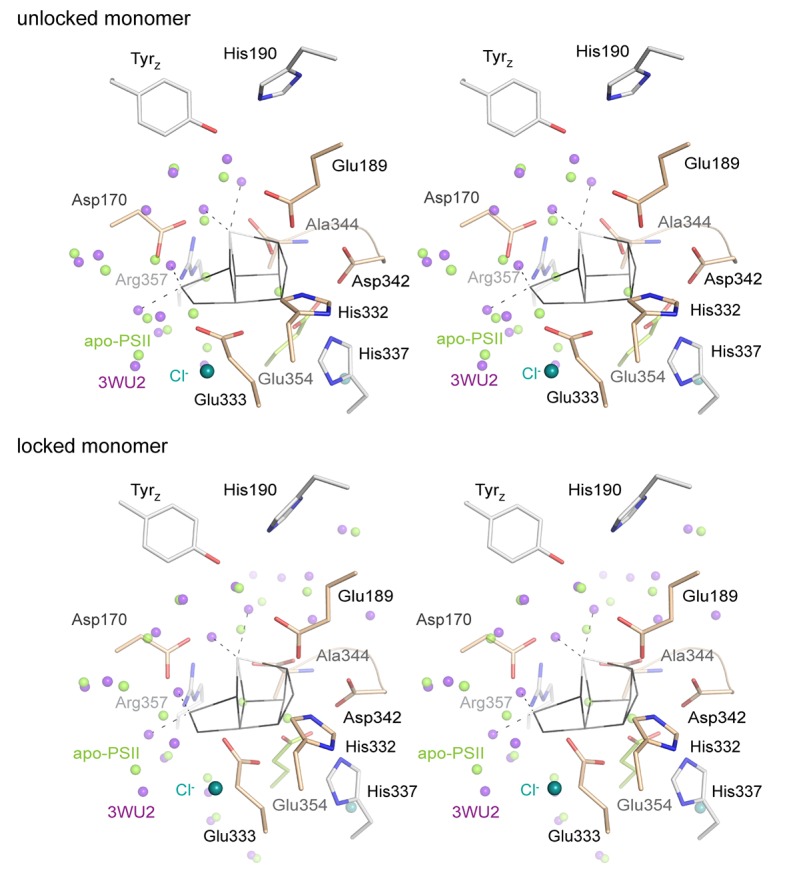
Figure 4—figure supplement 3. Stereo view comparing water positions at the WOC site in apo-PSII (green) with those in 3WU2 (purple).


