
Figure 5.
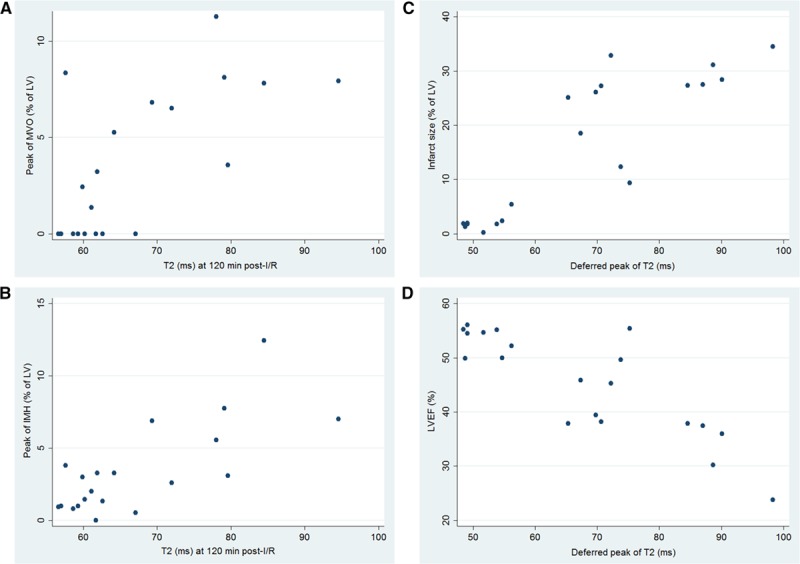
Association between T2, intramyocardial hemorrhage (IMH), microvascular obstruction (MVO), infarct size, and left ventricular ejection fraction (LVEF). Scatter plots showing positive association of T2 relaxation time in the ischemic myocardium during the hyperacute postreperfusion period (120 min) with (A) peak MVO (Pearson r=0.68) and (B) peak intramyocardial hemorrhage (Pearson r=0.75). C and D, The deferred T2 peak in the ischemic myocardium shows a strong positive association with day-7 infarct size (Pearson r=0.87) and a negative association with day-7 LVEF (Pearson r=−0.85). After adjustment for multiple testing, all P values for the correlations shown remained significant (P<0.05). Graphs include 4 groups of 5 pigs each undergoing 40-min ischemia/reperfusion (I/R; controls), 40-min I/R followed by postconditioning, 40-min I/R preceded by preconditioning, or 20-min I/R. LV indicates left ventricle.