
Figure 1.
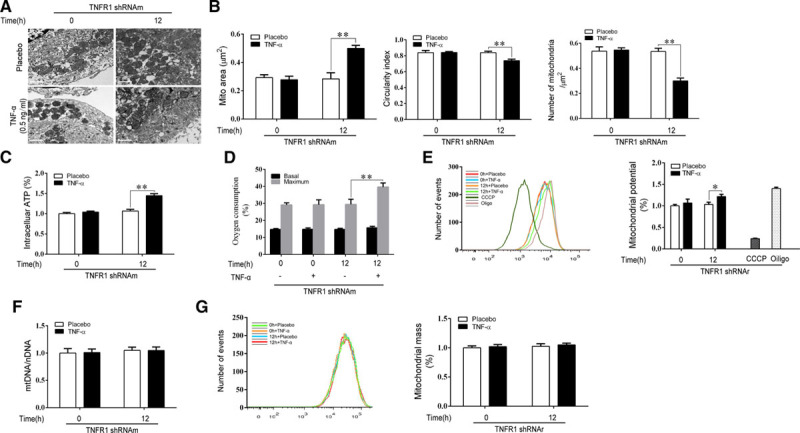
TNFR2 (TNFα receptor 2) activation increased mitochondrial fusion and function in NMCMs (neonatal mouse cardiac myocytes). A, NMCMs were transfected with shRNA targeting mouse TNFR1 (NMCMs-TNFR1-KD) and treated with either TNFα (0.5 ng/mL) or placebo for 12 h. Cells obtained before and after TNFα exposure were subjected to transmission electron microscopy (TEM) examination. Representative images are shown (bar=1 μm). B, The average mitochondrial area (μm2), circularity index, and number of mitochondria per μm2 were quantified via TEM analysis (n=3 separate studies, 100 mitochondria per group). C, Intracellular ATP levels were determined via luciferin/luciferase-based assays (n=3) involving NMCMs-TNFR1-KD. D, Oxygen consumption rates in NMCMs-TNFR1-KD were assayed under both basal and maximal conditions (ie, under carbonyl cyanide m-chlorophenylhydrazone [CCCP] treatment; n=3). E, Mitochondrial membrane potential (Δψm) was measured in H9C2 cells transfected with TNFR1-shRNAr and treated with either CCCP (50 μmol/L) or oligomycin (10 μmol/L), which served as negative and positive controls, respectively (n=3). The results are shown in the bar graph. F, Real-time polymerase chain reaction was performed to quantify mitochondrial cytochrome B (cytoB as mtDNA) expression levels, which were normalized to β-actin expression levels in NMCMs-TNFR1-KD to assess the total mitochondrial mass. G, MitoTracker Red staining was performed on H9C2 cells transfected with TNFR1-shRNAr to stain the mitochondria for flow cytometric analysis (n=3). *P<0.05, **P<0.01.