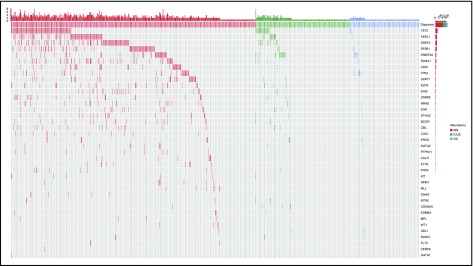
Figure 1.
Patterns of the mutations identified in the cohort of 683 patients with unexplained cytopenia. Distribution of somatic lesions in the analyzed genes according to the final diagnosis resulting from standard workup. Red color indicates a diagnosis of myeloid neoplasm; green indicates a diagnosis of ICUS, and blue indicates a diagnosis of other cytopenia. Each column represents an individual patient sample. MN, myeloid neoplasm; OC, other cytopenia.

