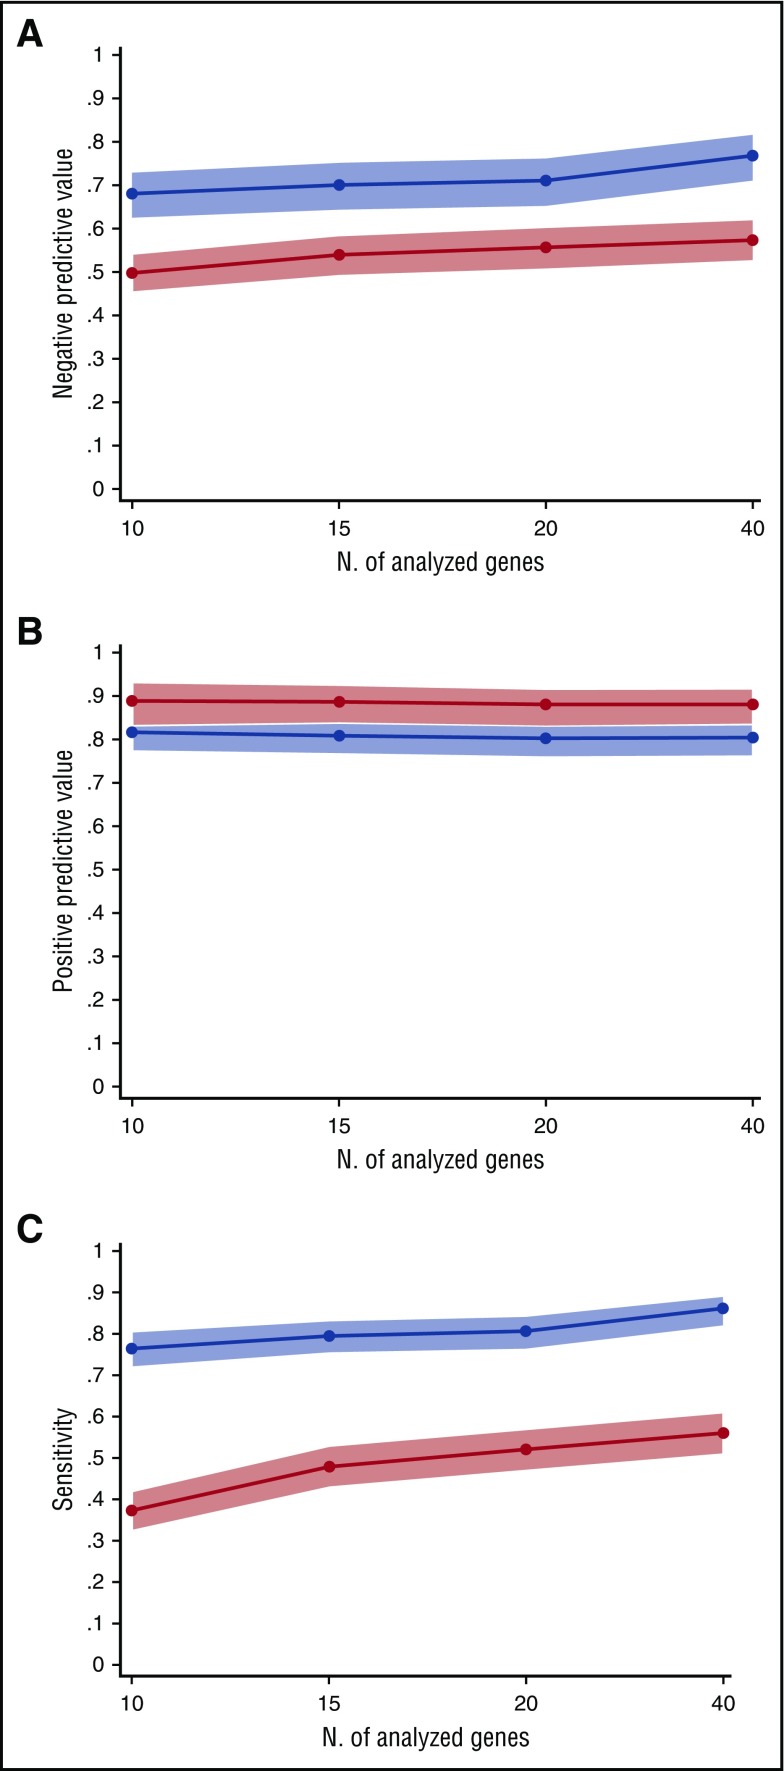
Figure 3.
Predictive values and sensitivity according to the number of analyzed genes. (A) Negative predictive value for diagnosis of myeloid neoplasms of 40-gene, 20-gene, 15-gene, and 10-gene panels (supplemental Table 12). The blue line represents the negative predictive value of an unmutated status, whereas the red line indicates the negative predictive value of having no or 1 somatic mutation in the set of analyzed genes. Light blue and red areas indicate 95% CIs. (B) Positive predictive value for diagnosis of myeloid neoplasms of 40-gene, 20-gene, 15-gene, and 10-gene panels. The blue line represents the positive predictive value of having 1 or more somatic mutations in the set of analyzed genes, whereas the red line indicates the positive predictive value of having 2 or more somatic mutations. (C) Sensitivity for diagnosis of myeloid neoplasms of 40-gene, 20-gene, 15-gene, and 10-gene panels. The blue line represents the sensitivity of having 1 or more somatic mutations in the set of analyzed genes, whereas the red line indicates the sensitivity of having 2 or more somatic mutations.

