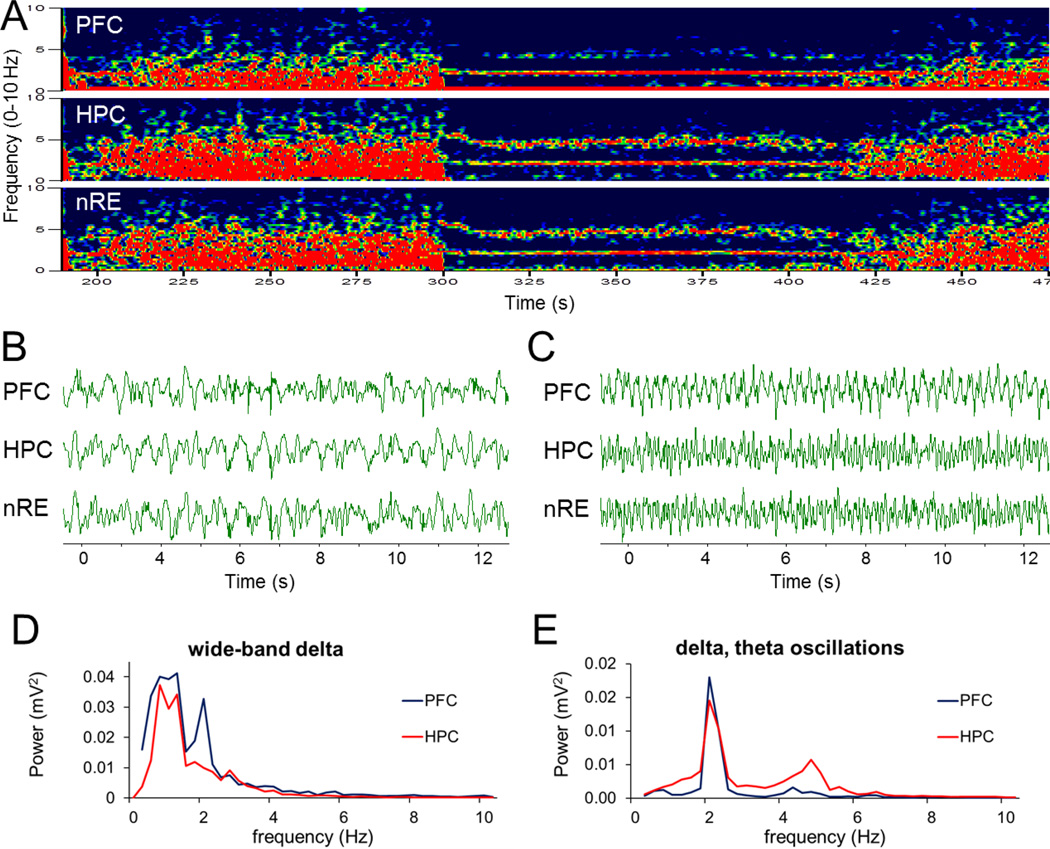
Figure 1. Spontaneous alternation between wide-band delta activity and simultaneous 2–5 Hz and theta oscillations in urethane anesthetized rats.
A. Example of time-frequency plots represents alternating wide-band delta activity and two oscillations at 1.9 and 4.6 Hz in PFC, HC and nRE. B and C. Sample LFP recordings on a faster time scale showing large amplitude irregular activity (B) and rhythmic activity (C). D and E. Power spectra of 75 s PFC and HC signals exhibiting wide-band spectral components (D) and sharp peaks (E), both within the delta range (power spectra overlaid for different signals were autoscaled to the largest peak). Voltage calibration in B and C: 0.5mV.

