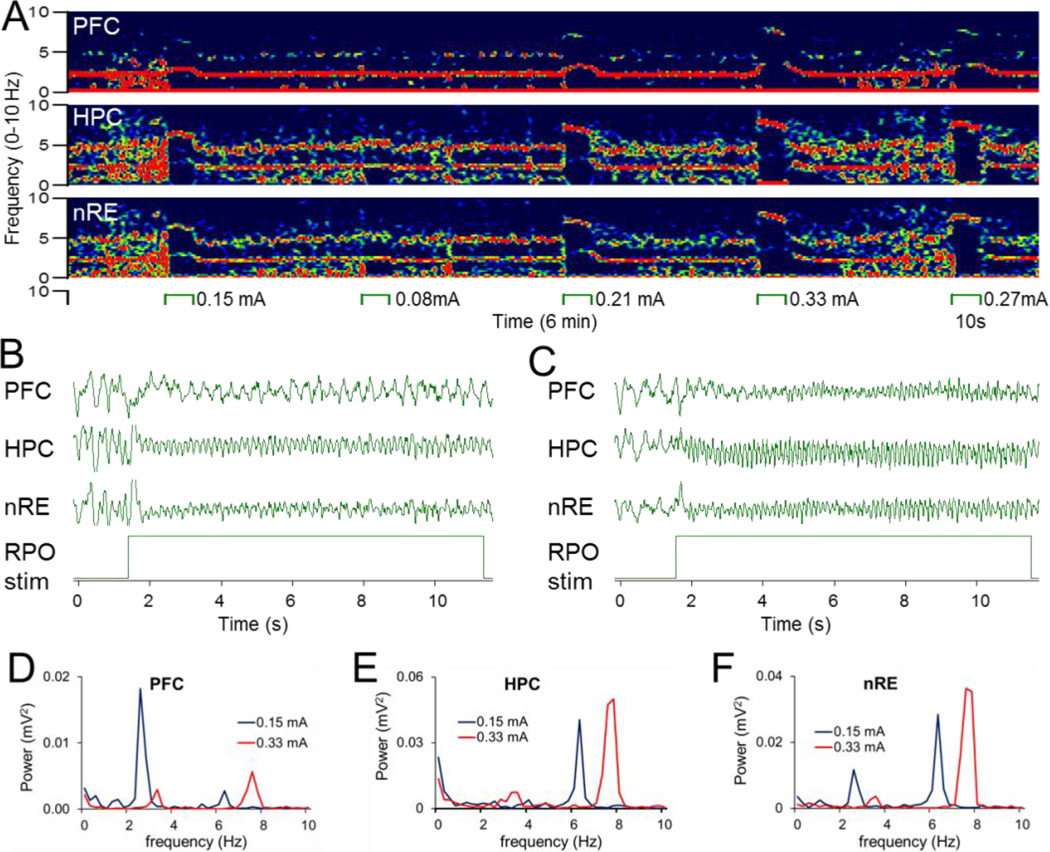
Figure 2. 2–5 Hz oscillation elicited in PFC simultaneously with HC theta by RPO stimulation.
A. Time-frequency plot demonstrating PFC, HC and nRE oscillations elicited by RPO stimulation at different intensities (between 0.08 and 0.33 mA). Note 2–5 Hz and theta expressed to different extent in different signals, e.g. 2–5 Hz in PFC, theta in HC, and both in nRE at 0.15 mA, and theta only in all signals at 0.33 mA. B. Sample LFP recordings of PFC 2–5 Hz oscillation and HC theta interrupting ongoing large amplitude irregular activity at the onset of RPO stimulation at low intensity (0.15 mA). (C). High intensity (0.33 mA) RPO stimulation induced theta in all 3 signals. D–F. Power spectra of PFC (D), HC (E), and nRE (F) LFP signals shown in B and C during low (blue) and high intensity (red) RPO stimulation. Note different scales for D-F. Voltage calibration in B and C: 0.5mV.

