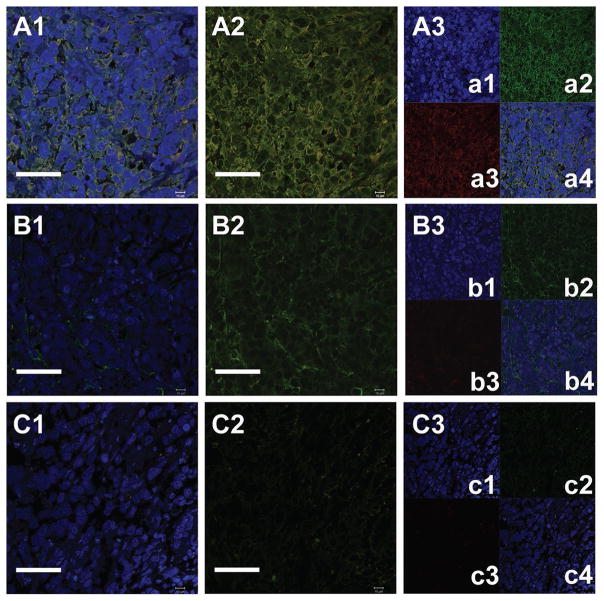
Figure 10.
Representative immunohistochemical analysis of xenograft sections treated with (A1–A3) DPBS, (B1–B3) CB6 Nic, and (C1–C3) CB6 CNP Nic observed in animal #7, 5, and 16, respectively. A1, B1, and C1 represent the β-actin stained cells with DAPI stained nucleus; A2, B2, C2 β-actin stained cells without nuclear staining and A3, B3, and C3 for individual staining of nucleus (a1, b1, c1); β-actin (a2, b2, c2); pSTAT3 (a3, b3, c3) and overlapped images (a4, b4, c4, and d4). It represents decrease in pSTAT3 staining (red) for CB6 Nic and CB6 CNP Nic treated tumor sections. The scale bar corresponds to 50 μm.

