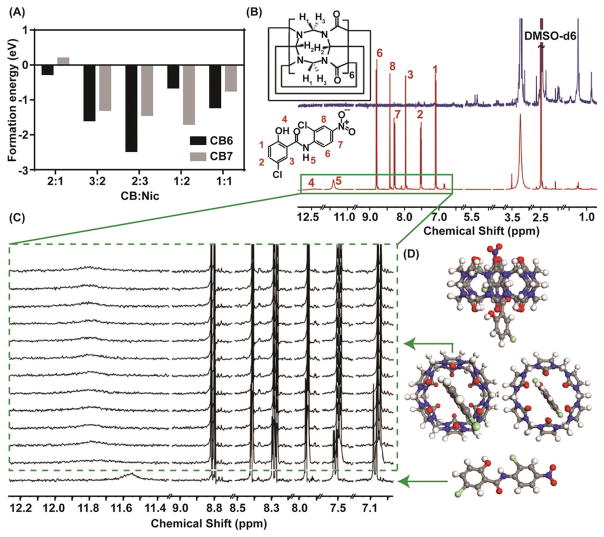
Figure 2.
A) The formation energy comparison obtained from computational studies revealed that in most of the given ratios, CB6 yields more stable complex compared to CB7; hence, justifying the application of CB6 for the experiments. B) 1H NMR titration studies to determine the feasibility of the interaction between host and guest. The Red graph is the 1H NMR spectrum of niclosamide and the navy blue one is the CB6 spectrum. All the measurements were done in DMSO- d6. C) The magnified box shows the region of interest in the titration studies. The green box indicates how the peak positions shift upon the addition of CB6 while maintaining niclosamide concentration. D) The ball and stick graphs indicate the energy minimized configuration obtained from ReaxFF simulation seen from various directions. The gray, white, blue, red, green correspond to C, H, N, O and Cl atoms, respectively.

