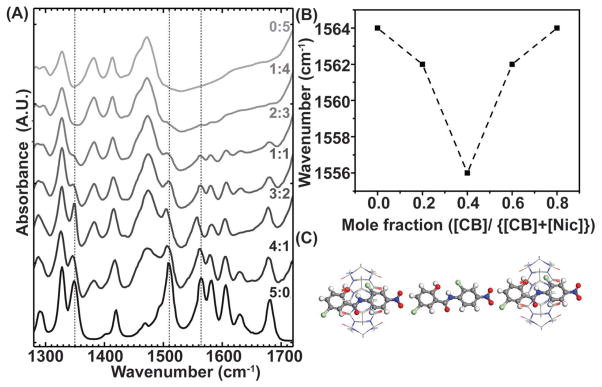
Figure 3.
The stoichiometry of the interaction was concluded from both experimental and in silico studies. A) The FT-IR spectra showing decreasing level of niclosamide: CB6 ratio from bottom to the top. B) The derived Job’s plot obtained from Amide I peak. The minimum of the graph corresponds to the most energetically favorable configuration. C) 2:3 configuration after energy minimization.

