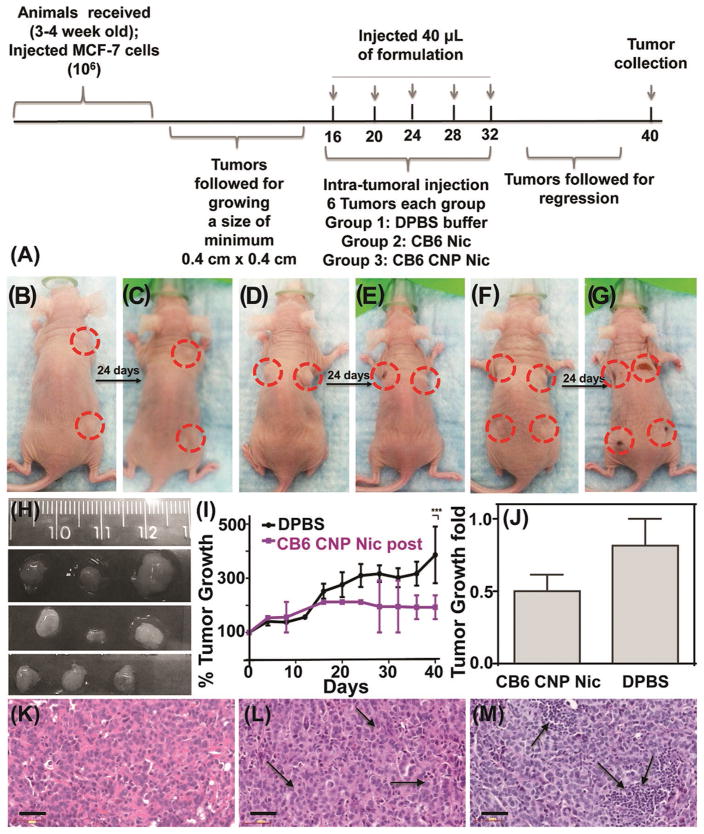
Figure 9.
In vivo results on xenograft mouse model. A) Timeline of experiment; representative animals with tumors before and after treatment with B,C) DPBS; D,E) CB6 Nic and F,G) CB6 CNP Nic. H) Tumors collected after sacrificing the animals treated with DPBS (Top line); CB6 Nic (Middle line) and CB6 CNP Nic (Bottom line). I) Tumor growth curves with time and J) fold change. H&E images of tumor sections for treatments with K) DPBS; L) CB6 Nic and M) CB6 CNP Nic. An unpaired t test was performed between % tumor growth values in animals with DPBS treatment and CB6 CNP Nic to reach a two tailed p-value < 0.001, represented as ***. Scale bar is 50 μm.

