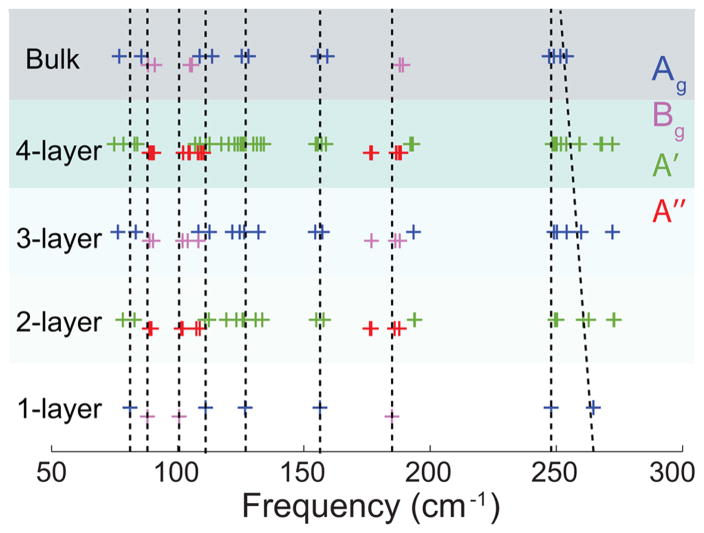
Figure 10.
Raman active modes of N-layer MoTe2 are plotted. Blue, magenta, green, and red symbols denote Ag, Bg, A′, and A″ modes, respectively. The Bg and A″ are offset from the Ag and A′ modes for clarity. Dashed lines are drawn as guides for comparison of the peak frequencies between the five materials.

