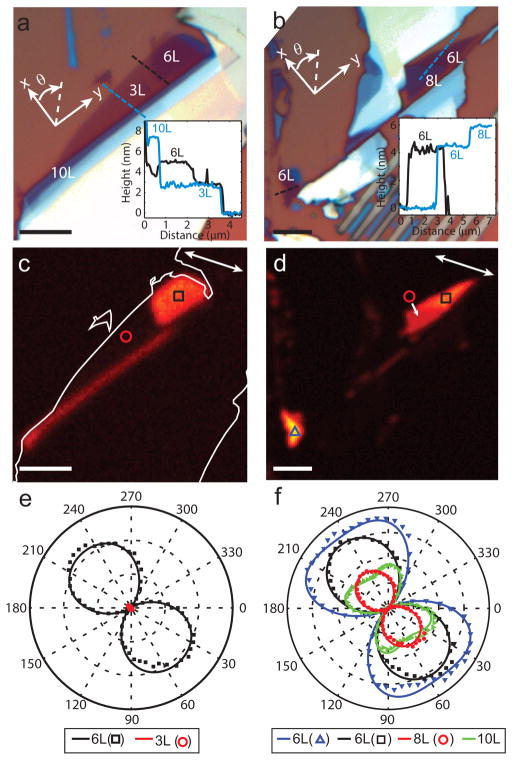
Figure 4.
(a, b) White light images with the layer thicknesses and crystallographic axes labeled. Insets: AFM profiles along the black and blue dashed lines. (c, d) SHG images with the excitation polarization direction shown as a white arrow. Color contrast is scaled by ×2 in (c) compared to (d). (e) SHG polarization polar map with the polarizer and analyzer parallel acquired at the black square (N = 6) and red circle (N = 3) in (c) are shown in black and red, respectively. (f) SHG polarization polar map with the polarizer and analyzer parallel acquired at the blue triangle (N = 6), the black square (N = 6), red circle (N = 8) in (d) and a nearby region (N = 8) are shown in blue, black, red, and green, respectively. The angle in the polar plots is relative to the horizontal axis in (b and c). Scale bar = 5 μm.

