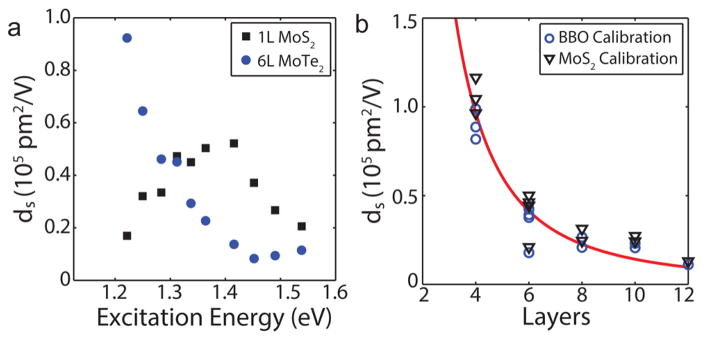
Figure 5.
(a) Wavelength-dependent ds of 1T′ MoTe2 (blue circles) and monolayer MoS2 (black squares) calibrated using BBO. (b) Layer-dependent surface second-order susceptibility, ds, of 1T′MoTe2 calibrated using BBO (blue circles) and monolayer MoS2 (black triangles). Solid line is empirically fit using ds(N) = 1.8x10⁶ N−2 pm2/V.

