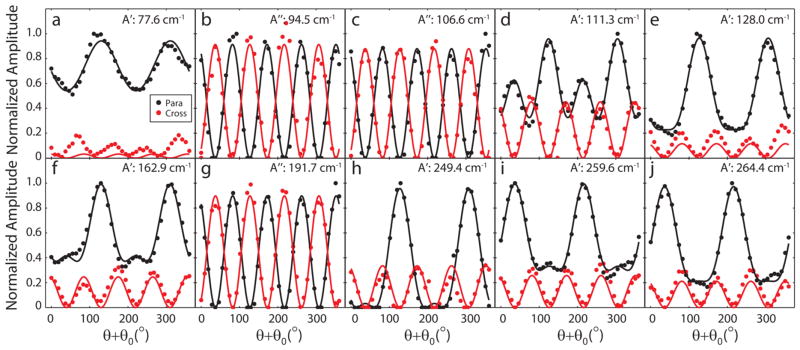
Figure 7.
Normalized Raman amplitudes for parallel (red) and crossed (black) polarizations for the N = 12 region. The solid lines are the fits using the complex Raman tensors. The symmetry and frequency for each mode are labeled. The fits give θ0 = −53°. Taking into account the difference in mounting angle between the SHG and Raman systems (≈−10°), the crystal orientations from the Raman measurements are in excellent agreement with the SHG measurements.

