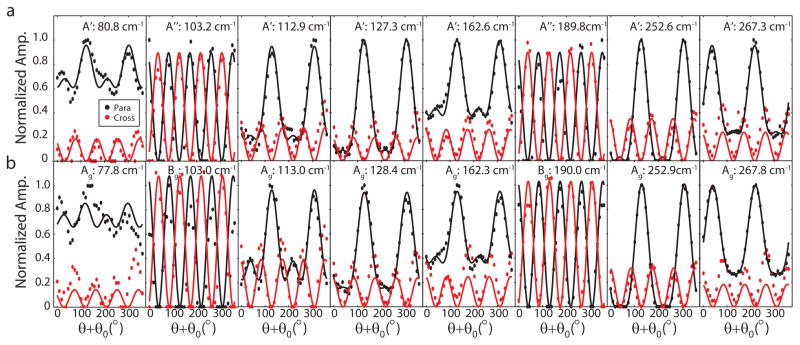
Figure 8.
Normalized Raman amplitudes for parallel (red) and crossed (black) polarizations for the (a) N = 4 and (b) N = 3 regions of the sample in Figure 1. The solid lines are the fits using the complex Raman tensors. The symmetry and frequency for each mode are labeled. The fits give θ0 = −52.5°. Taking into account the difference in mounting angle between the SHG and Raman systems (≈−10°), the crystal orientations from the Raman measurements are in excellent agreement with the SHG measurements.

