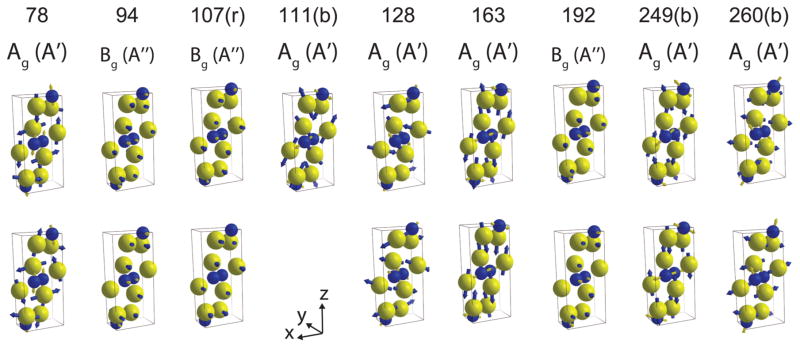
Figure 9.
Summary of the Raman modes in N-layer 1T′ MoTe2 with N odd and N even. Modes that blue or red shift as the crystals get thinner are indicated with (b) and (r), respectively. Reported Raman shifts are for N = 12. Normal mode atomic displacements of bulk 1T′-MoTe2 are shown as blue and yellow arrows for displacement of Te and Mo atoms, respectively. The magnitude of the displacements is proportional to the length of arrows. Blue and yellow spheres denote Mo and Te atoms, respectively. The primitive cells of bulk 1T′-MoTe2 are shown by black boxes.

