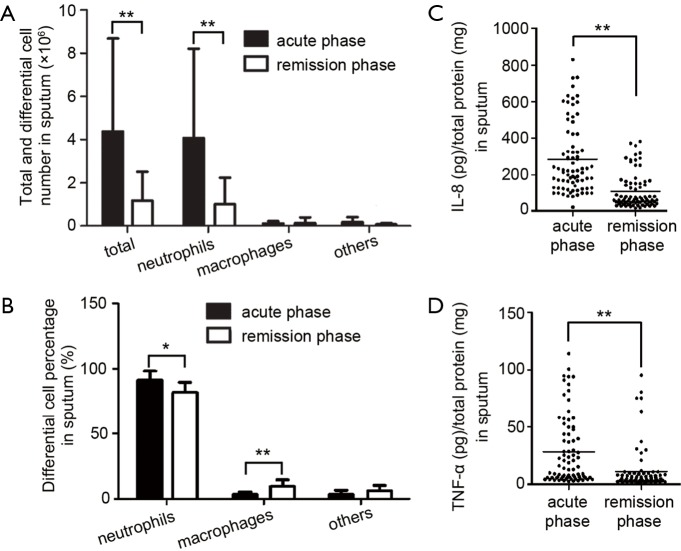
Figure 2.
Increased leucocytes and inflammatory cytokines in induced sputum. The total cells were separated from induced sputum by centrifuge. (A) The cells were resuspended in PBS and total leucocytes were counted. The differential counting of the cells was done after hematoxylin and eosin (H&E) staining; (B) the percentage of differential cells was calculated. Values are presented as mean ± SEM and analyzed with Mann Whitney U test, **P<0.01 and *P<0.05 (n=78); (C,D) the levels of IL-8 and TNF-α in supernatant were measured by ELISA. Horizontal bars indicate mean values. Values are analyzed with Mann Whitney U test, **P<0.01 and *P<0.05 (n=78).

