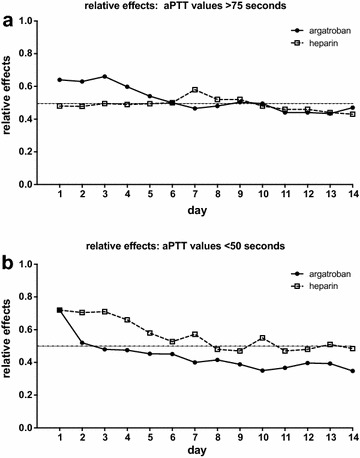
Fig. 3.

a Exceedances of aPTT values >75 s over the course of time in ARDS patients undergoing extracorporeal lung support with either argatroban or heparin as anticoagulant; depicted as relative effect over time; argatroban ****p < 0.0001; heparin p = 0.26. b aPTT values below 50 s over the course of time, depicted as relative effect over time; argatroban and heparin ****p < 0.0001. The relative effect does not represent the measured values of that parameter, but presents (on a scale of 0–1) the treatment effect of the specific group, relative to all groups and therefore to a ‘mean’ treatment effect. Multivariate nonparametric analysis for longitudinal data (MANOVA; Brunner’s analysis)
