
Fig. 4.
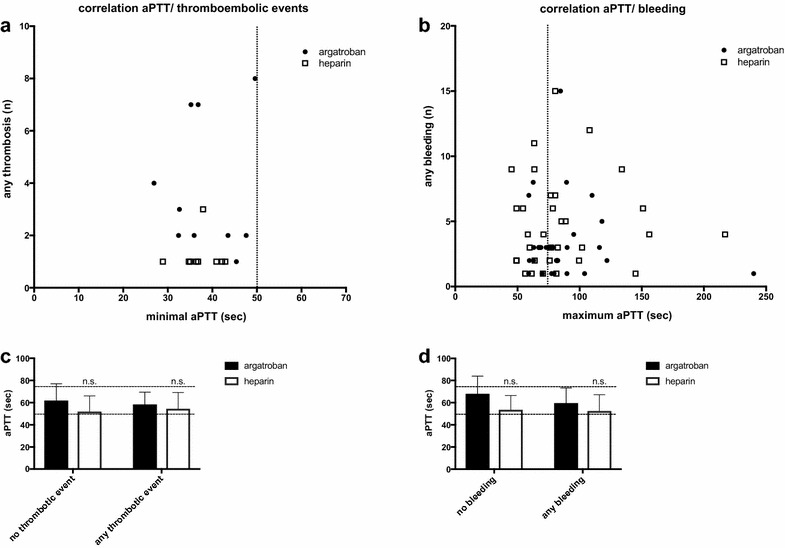
a Correlation of any thromboembolic event (n) and the minimal aPTT value (s) and b correlation of any bleeding event (n) and the maximal aPTT value (s) in ARDS patients undergoing extracorporeal lung support with either argatroban or heparin as anticoagulant (solid circle = argatroban; open square = heparin). Data are presented as scattered plot; each dot represents a patient with anticoagulation and the associated number of thromboembolic episodes or bleeding events, respectively. Vertical dotted lines represent the targeted aPTT corridor of 50–75 s. c, d Comparison of mean aPTT values of ARDS patients undergoing extracorporeal lung support with either argatroban or heparin as anticoagulant with or without thromboembolic events (c) and with or without any bleeding episode (d). Data are presented as mean ± standard error of the mean (SEM) and were analyzed with a Mann–Whitney U test for nonparametric samples. n.s. no significant differences between argatroban and heparin group; n number; APTT activated thromboplastin time; s seconds