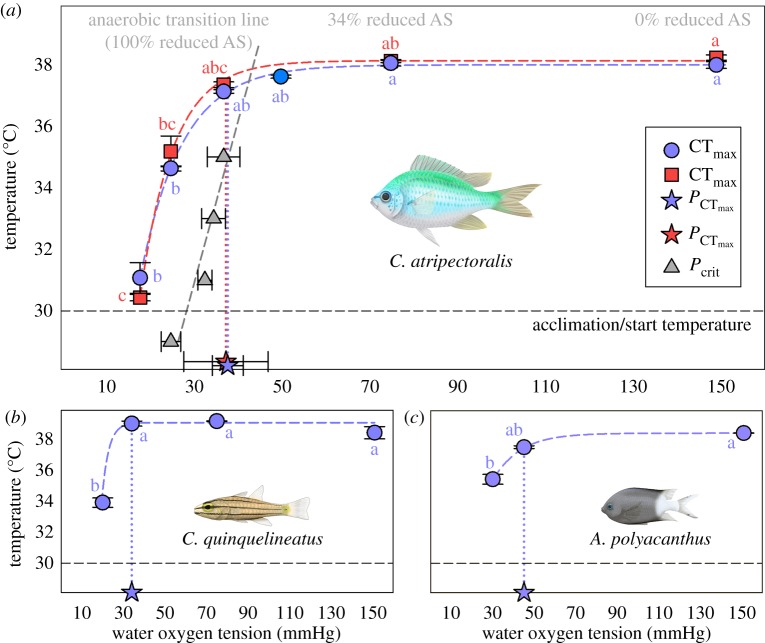
Figure 1.
Change in the critical thermal maximum (CTmax) (blue circles) with declining water oxygen tension (PwO2) (one-way ANOVA, p < 0.05), and the oxygen limit for thermal tolerance ( ) (stars) in (a) C. atripectoralis (N = 5), (b) C. quinquelineatus (N = 5) and (c) A. polyacanthus (N = 5). For (a) C. atripectoralis (N = 8), the critical oxygen tension (Pcrit) (grey triangles) increased with temperature, and the aerobic scope (AS) was maintained at normoxia (i.e. 0% reduction), reduced by 34% at 75 mmHg, and by 100% at the anaerobic transition line (grey dashed line) (see test and electronic supplementary material, table S1 for details). In (a) C. atripectoralis, the CTmax that was measured above the anaerobic transition line was not significantly different from the CTmax measured at normoxia, but decreased significantly with PwO2 when measured below the anaerobic transition line (one-way ANOVA, p < 0.05). In (a) C. atripectoralis (N = 5), the hypoxia sensitivity of CTmax was not affected by 14 days acclimation to elevated CO2 (red squares) (two-way ANOVA, p < 0.05). Values are means ± 1 s.e.m. Illustrations by Erin Walsh.

