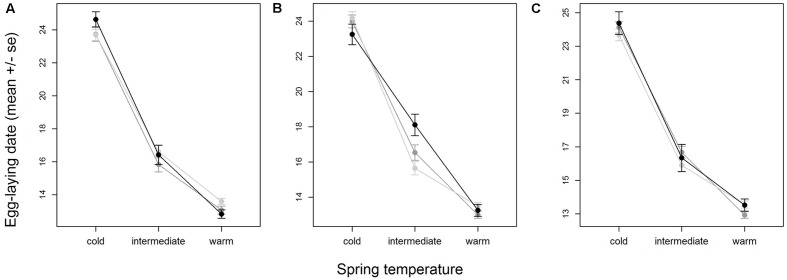
FIGURE 3.
Variation in egg-laying dates of SNP genotypes with temperature for the three SNPs with the most significant interaction with temperature (Table 2), AX-100216683 (A), AX-100724221 (B) and AX-100140360 (C). Shown are means and standard errors, indicated by whiskers, for homozygote 1 (light gray), heterozygote (medium gray) and homozygote 2 (black). Plotting the area- and year-centered egg-laying dates that were used in the analysis would give a horizontal mean reaction norm. To show the real differences in egg-laying dates with temperature, we here plotted ‘raw’ egg-laying dates that were not corrected for year- and area effects. Note that therefore part of the variation within SNP- and temperature-classes is due to variation among areas. Sample sizes per temperature class-genotype group ranged between 77 and 757 individuals and were on average 381.2.

