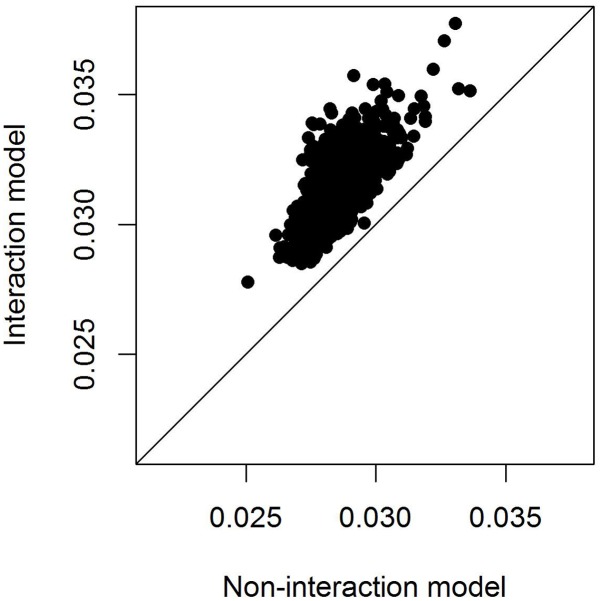
FIGURE 4.
Adjusted marginal r2 of models with and without SNP∗temperature interaction. The marginal r2 measures the variation explained by fixed effects only and is hence appropriate here because the random effects structure of the models is identical. The r2 is only plotted for models in which either the SNP effect or the interaction SNP∗temperature was significant at the 0.05 level.

